Boris Müller Interaction Design
Boris Müller is professor for Interface Design at the University of Applied Sciences Potsdam and co-director of the UCLAB.

Prof. Boris Müller has a Diploma in Graphic Design from the Hochschule für Künste Bremen (College of Art and Design Bremen, Germany) and a MA in Computer Related Design from the Royal College of Art London.
He has worked for a number of international clients and companies like MetaDesign San Francisco, the Science Museum London and the Fraunhofer Institute for Media Communication in Bonn. After being a visiting Professor at the Interaction Design Institute Ivrea, he became a Professor for Interaction Design at the newly founded Interface Design course at the University of Applied Sciences Potsdam.
His design work has received several awards like the Excellence Award from the Media Arts Festival in Tokyo, a Certificate of Typographic Excellence from the Type Directors Club New York or the first prize in the student’s category of the EuroPrix Multimedia.
As part of his ongoing research, he is currently publishing a series of essays on interaction design and visualization.
Projects Contributions
IPPSO
Transdisciplinary Legal, Public Policy, and Design Research on Immersive Phygital Public Spaces in Smart Cities
ARETE
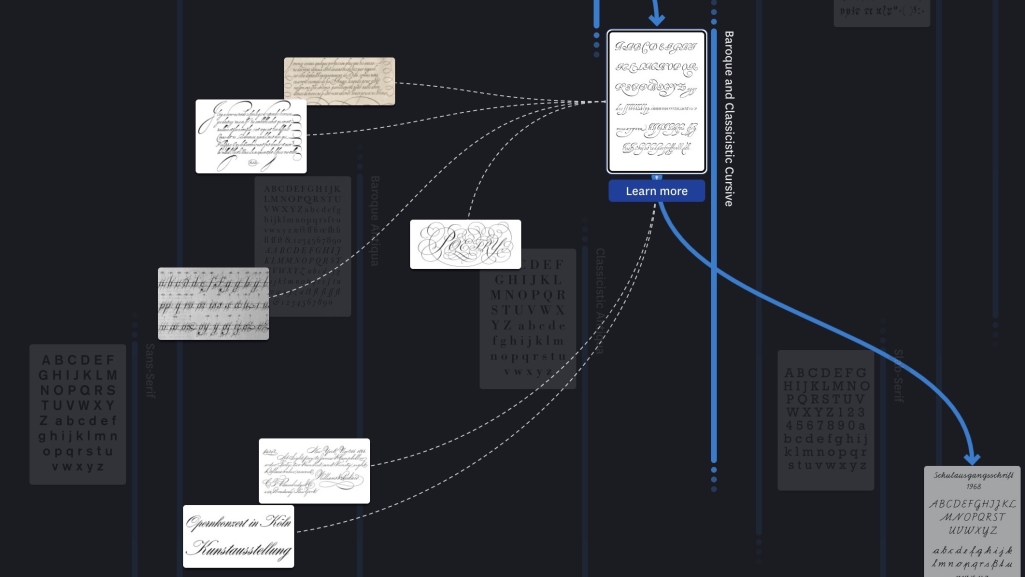
A Visual History of the Latin Alphabet
Topography of Violence
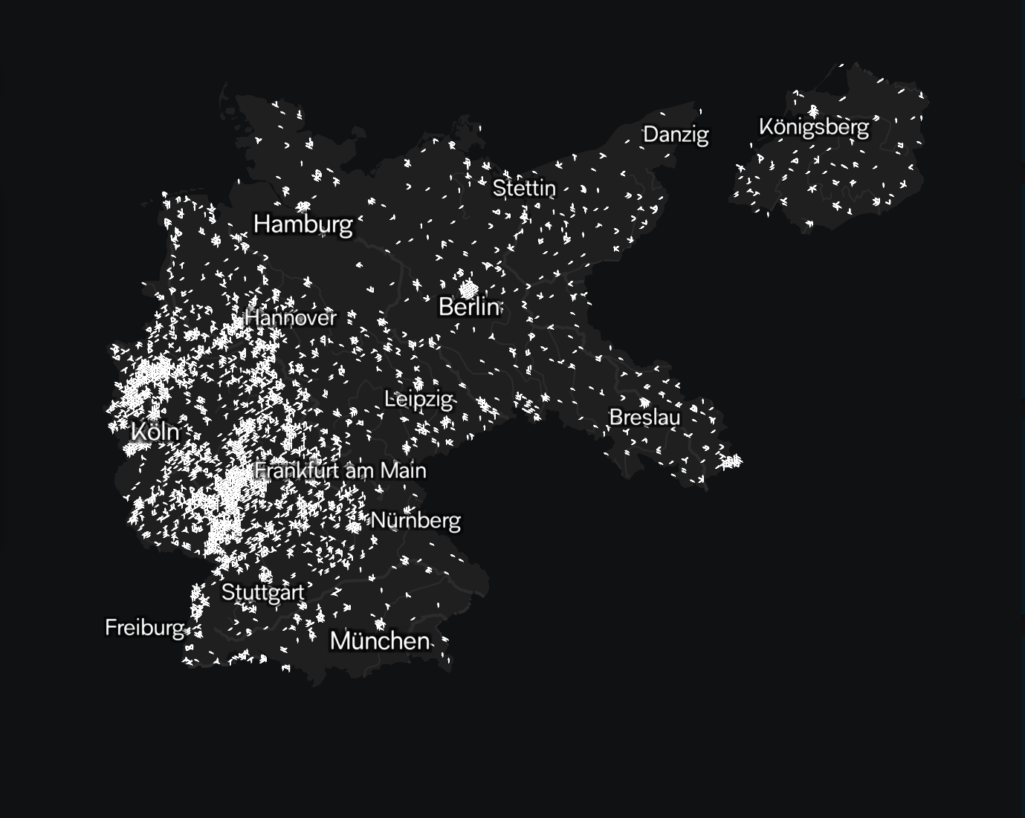
Visualizing antisemitic violence in Germany 1930–1938
SENSES
Visualization and Communication of Climate Change Scenarios
INFORMATION+ 2018
International conference on information design & visualization in Potsdam
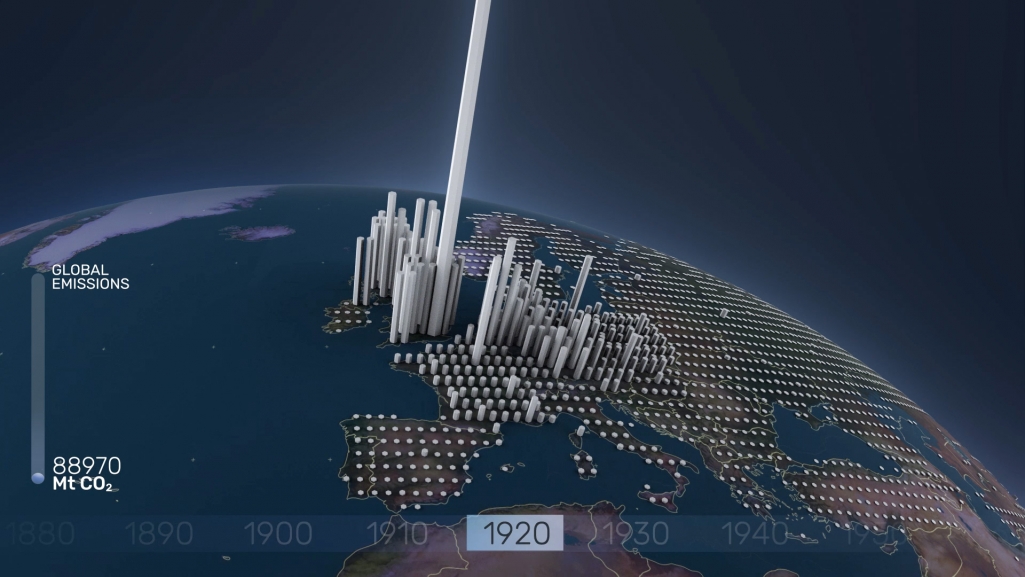
A Brief History of CO2 Emissions
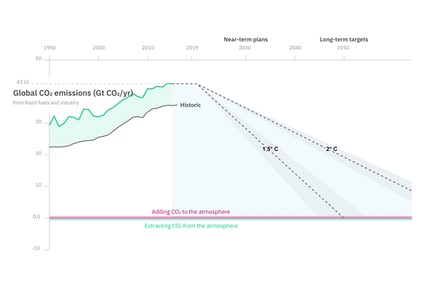
An animated short film on greenhouse gas emissions
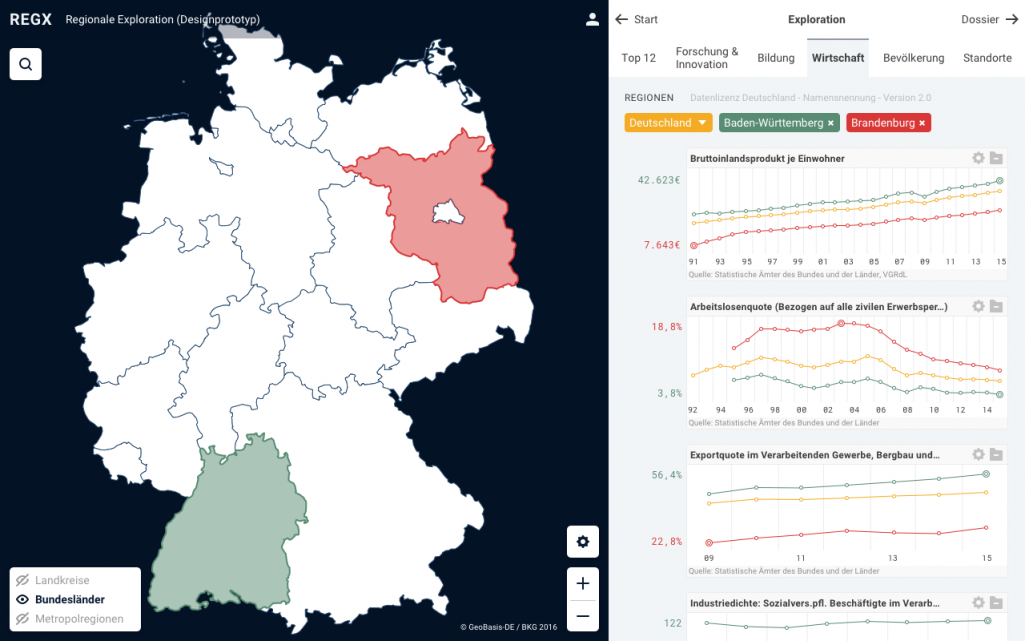
VIND
Visualization interfaces and user centered design for complex databases
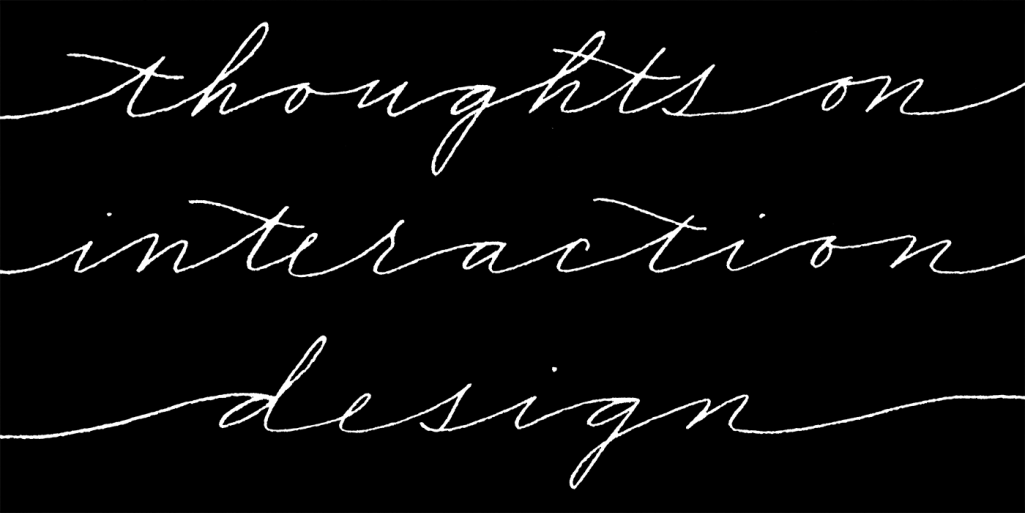
Thoughts on Interaction Design
An essay series by Boris Müller
Shifted Maps
Revealing networks in personal movement data
Probing Projections
Interaction techniques for interpreting dimensionality reductions
Micro Visualisations
How can visualisations enhance typography?
Culturegraphy
Visualizing cultural network dynamics
Publications Published Works
Climate change scenario services: From science to facilitating action
The goal of limiting global warming to well below 2°C as set out in the Paris Agreement calls for a strategic assessment of societal pathways and policy strategies. Besides policy makers, new powerful actors from the private sector, including finance, have stepped up to engage in forward-looking assessments of a Paris-compliant and climate-resilient future. Climate change scenarios have addressed this demand by providing scientific insights on the possible pathways ahead to limit warming in line with the Paris climate goal. Despite the increased interest, the potential of climate change scenarios has not been fully unleashed, mostly due to a lack of an intermediary service that provides guidance and access to climate change scenarios. This perspective presents the concept of a climate change scenario service, its components, and a prototypical implementation to overcome this shortcoming aiming to make scenarios accessible to a broader audience of societal actors and decision makers.
Keywords: climate change scenarios; climate change scenario services; climate services; co-production; visualization; capacity building; mitigation scenarios; adaptation scenarios; impact projections
Co-Designing Visualizations for Information Seeking and Knowledge Management
Shifted Maps: Revealing spatio-temporal topologies in movement data
We present a hybrid visualization technique that integrates maps into network visualizations to reveal and analyze diverse topologies in geospatial movement data. With the rise of GPS tracking in various contexts such as smartphones and vehicles there has been a drastic increase in geospatial data being collect for personal reflection and organizational optimization. The generated movement datasets contain both geographical and temporal information, from which rich relational information can be derived. Common map visualizations perform especially well in revealing basic spatial patterns, but pay less attention to more nuanced relational properties. In contrast, network visualizations represent the specific topological structure of a dataset through the visual connections of nodes and their positioning. So far there has been relatively little research on combining these two approaches. Shifted Maps aims to bring maps and network visualizations together as equals. The visualization of places shown as circular map extracts and movements between places shown as edges, can be analyzed in different network arrangements, which reveal spatial and temporal topologies of movement data. We implemented a web-based prototype and report on challenges and opportunities about a novel network layout of places gathered during a qualitative evaluation.
Culturegraphy
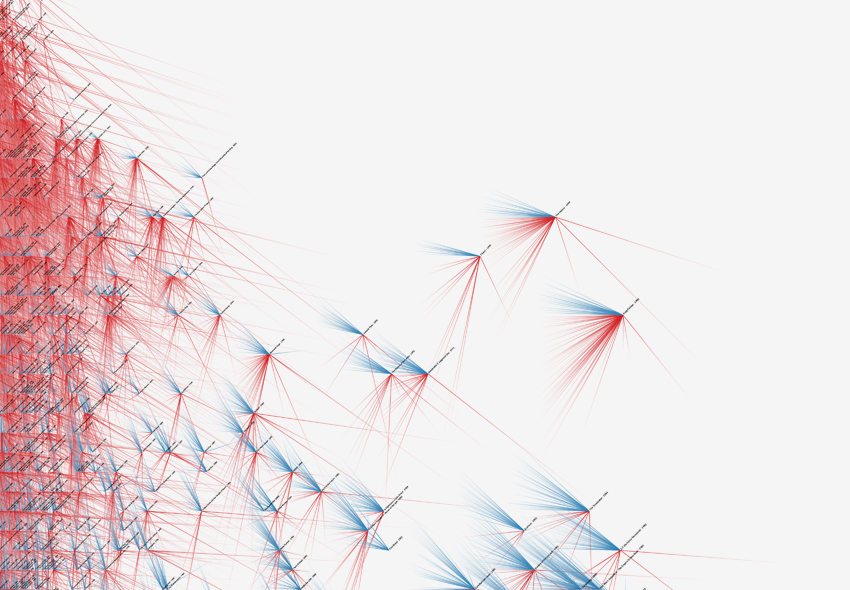
Culturegraphy visualizes the exchange of cultural information over time. Treating cultural works as nodes and influences as directed edges the visualization of these cultural networks can provide new insights into the rich interconnections of cultural development such as movie references. All findings were made in a process that involved network scientists, a media theorist, and a sociologist. The role that visualization can play in bridging scientific communities was central to this work. In this sense, the resulting visualizations were process to bring researchers from different disciplines together. Traditionally using different methods, physicists increasingly ask similar questions as media theorists or sociologists as they study the dynamics in networks. Visualization can serve as a common language that brings fields together, shows differences, but also has its own idiosyncratic views.
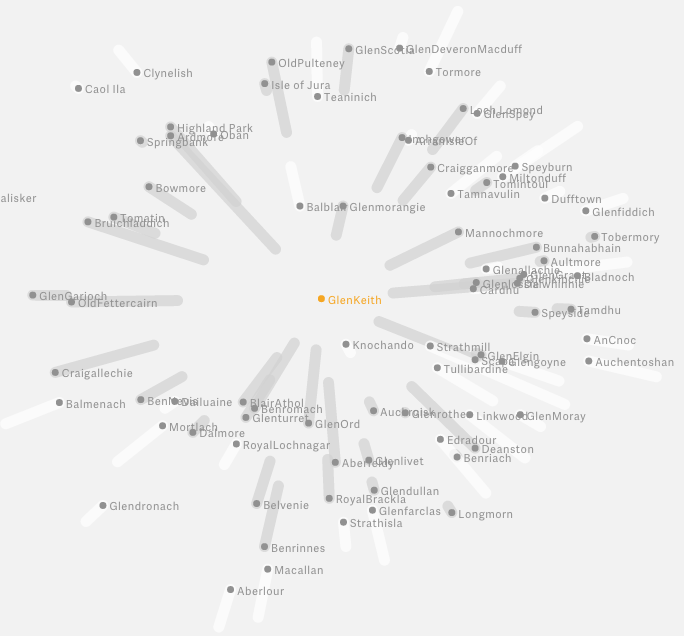
Probing Projections: Interaction Techniques for Interpreting Arrangements and Errors of Dimensionality Reductions
We introduce a set of integrated interaction techniques to interpret and interrogate dimensionality-reduced data. Projection techniques generally aim to make a high-dimensional information space visible in form of a planar layout. However, the meaning of the resulting data projections can be hard to grasp. It is seldom clear why elements are placed far apart or close together and the inevitable approximation errors of any projection technique are not exposed to the viewer. Previous research on dimensionality reduction focuses on the efficient generation of data projections, interactive customisation of the model, and comparison of different projection techniques. There has been only little research on how the visualization resulting from data projection is interacted with. We propose a set of interactive visualization methods to examine the dimensionality-reduced data as well as the projection itself. The methods let viewers see approximation errors, question the positioning of elements, compare them to each other, and visualize the influence of data dimensions on the projection space. We created a web-based system implementing these methods, and report on findings from an evaluation with data analysts using the prototype to examine multidimensional datasets.
Are there networks in maps? An experimental visualization of personal movement data
Shifted Maps proposes a novel visualization method to generate personal geovisualizations of individual movement data. The resulting visual appearance can be characterized as a map network consisting of visited places and their connections. The visited places are shown as circular map extracts scaled according to the time spent there and the movements between the places are represented as edges between the places. A key feature of the Shifted Maps visualization is the possibility to explore the data in three different arrangements based on geo-spatial position, travel time, and frequency of movements. By combining map and network visualizations of movement data, it becomes possible to analyze and compare spatial and temporal topologies.
Culturegraphy — Visualizing Cultural Network Dynamics
Culturegraphy visualizes cultural information exchange over time. Treating cultural works as nodes and influences as directed edges, the visualization of these cultural networks can provide new insights into the rich interconnections of cultural development. The graphics represent complex relationships of movie references by combining macro views summarizing 100 years of movie influences with micro views providing a close-up look at the embedding of individual movies. The macro view shows the rise of the self-referential character of postmodern cinema, while the micro level illustrates differences between individual movies, when they were referenced and by whom. The visualizations provide views that are closer to the real complexity of the relationships than aggregated views or rankings could do.

