VIND Visualization interfaces and user centered design for complex databases
Digital knowledge management systems have become an essential tool for running large scale institutions and strategic planning. However, most systems lack an adequate software interface that enables the users to visualize and directly interact with the data. The VIND project applied a user-centered design approach to a data-driven software system. Our aim was to create data visualizations that also excel as user interfaces – and vice versa.
The aim of the research project VIND was to merge scientific insights from the areas of data visualization and user interface design in order to develop innovative visual and user-centered interfaces for complex database systems.
For this, we collaborated with a higher governmental department. We were able to utilize an actively used complex knowledge management system as an empirical basis for the design and development of user interface components and data visualizations.
The VIND project investigated the applicability of innovative data visualization components in the context of knowledge management systems. In order to achieve this, we initiated a “classic” user-centered design process. Conducting interviews, contextual inquiries and creating personas allowed us to understand and define user needs.
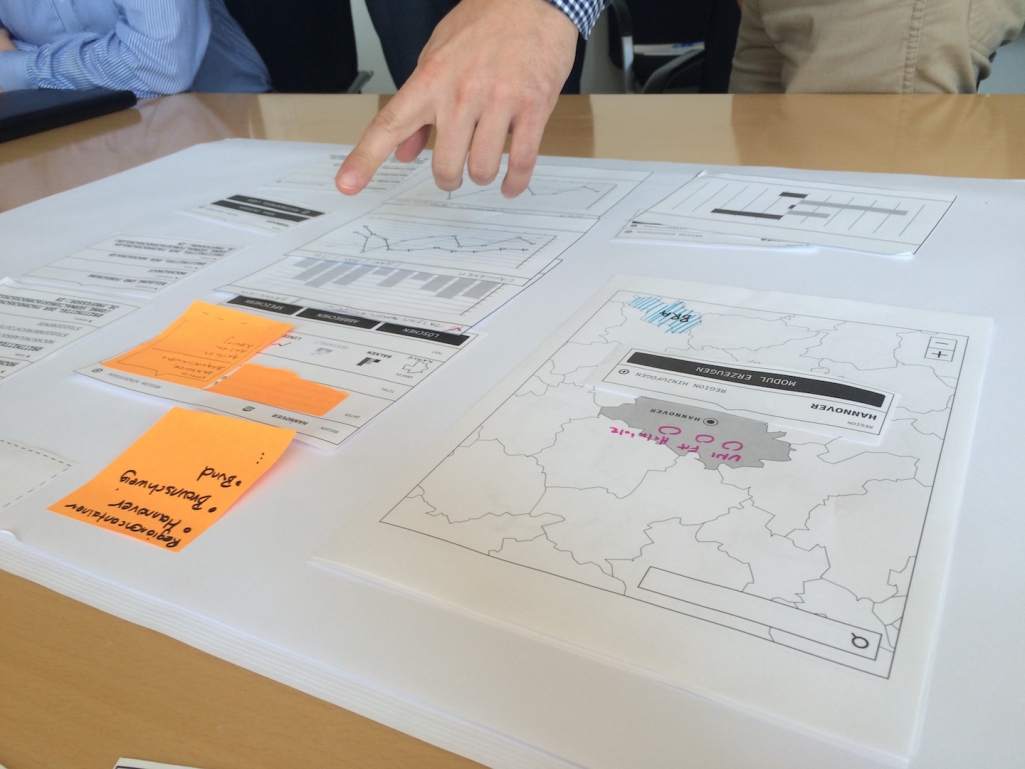
Based on these insights we were able to start a co-creation process with users, developers, managers and other stakeholders. The aim of the co-creation process was to develop ideas for visualization components that both meet the needs of the user and that convey the inherent complexities and relationships of the data in a flexible, innovative and understandable way. At a higher level, the strong involvement of the different stakeholders over the whole design process ensured the development of a shared language and a feeling of ownership on the stakeholders’ side.
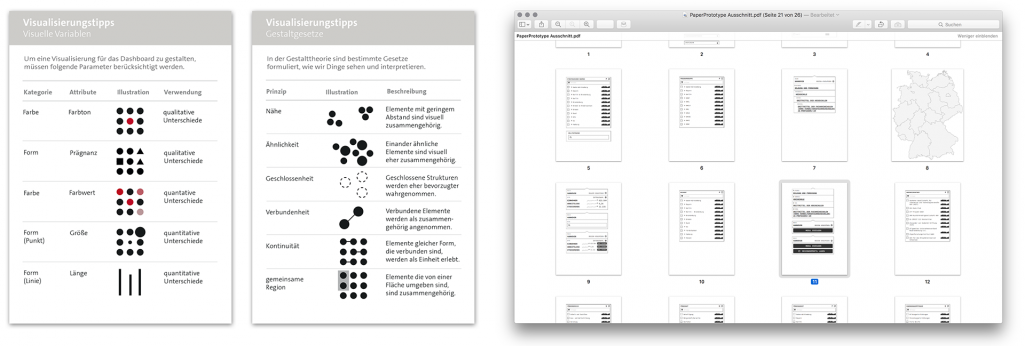
Essential to the process was the application of well-prepared templates and guidelines. For the co-creation workshops, we prepared brief guidelines to gestalt principles and visual variables as well as simple interface and visualization elements on paper. During the workshops we encouraged the participants to play, design and experiment with the elements and develop interfaces and visualization components suited to specific use cases. Templates and guidelines helped participants to overcome their inhibitions of “being creative” and to start sketching and tinkering right away.
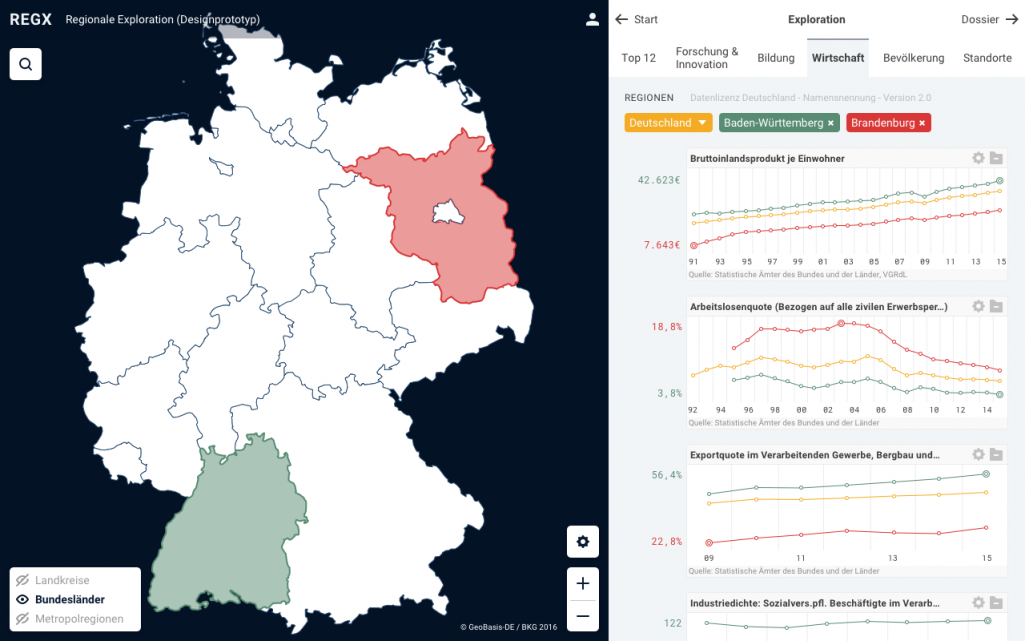
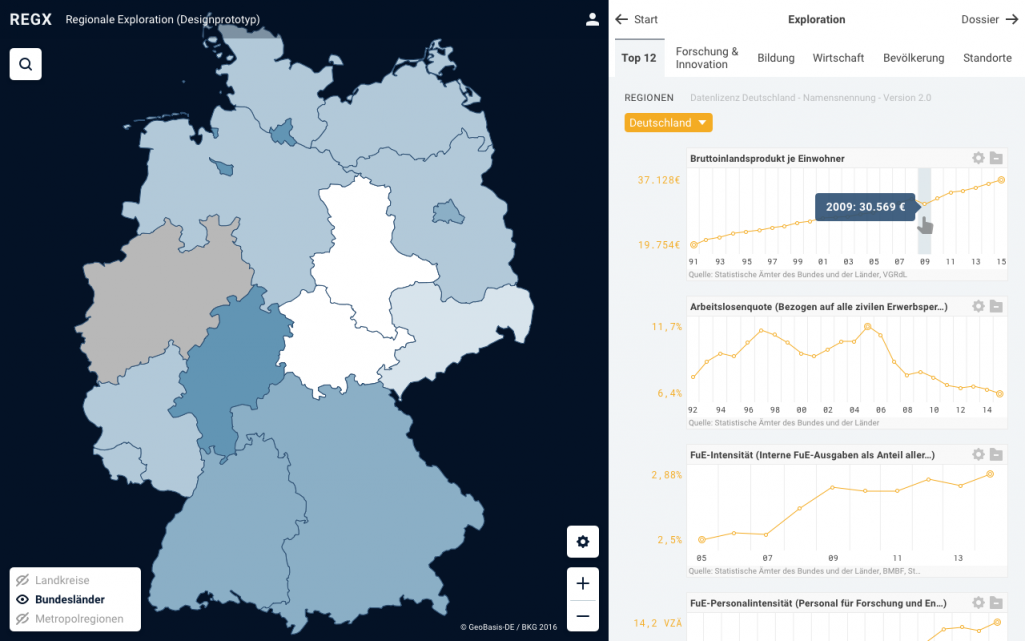
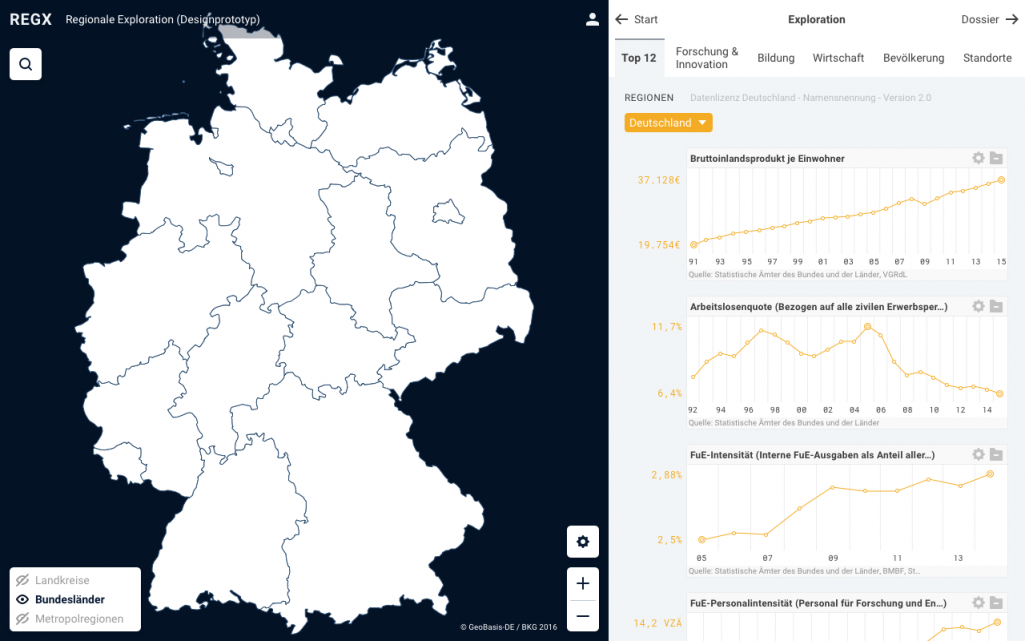
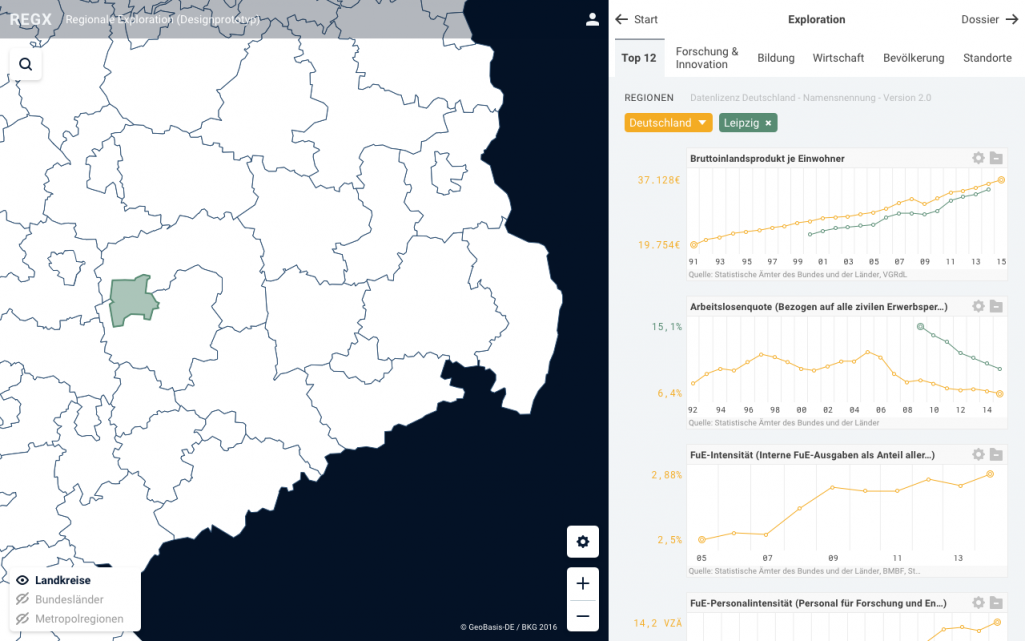
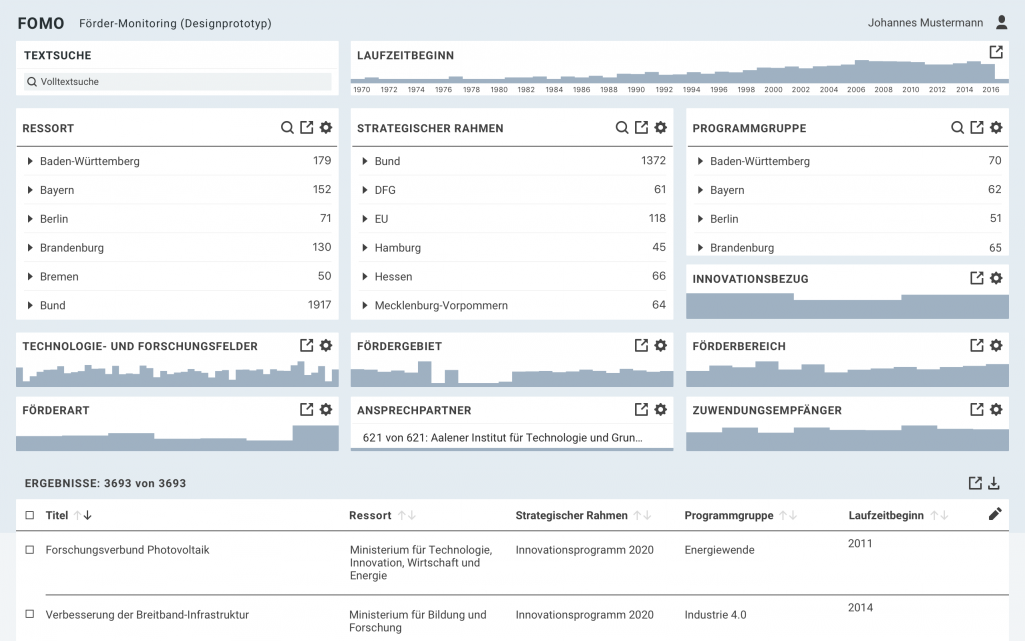
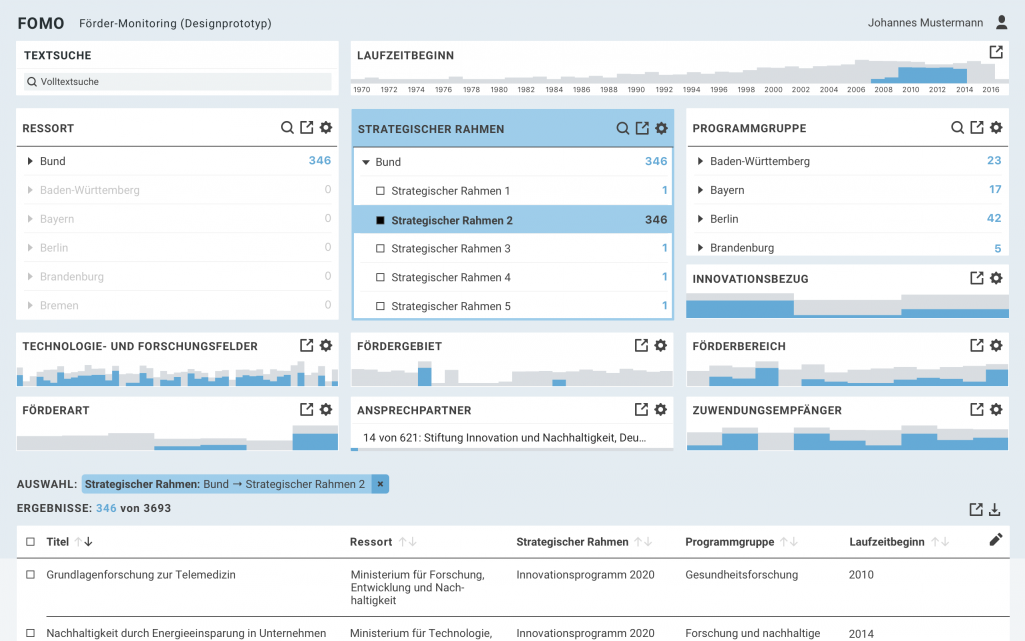
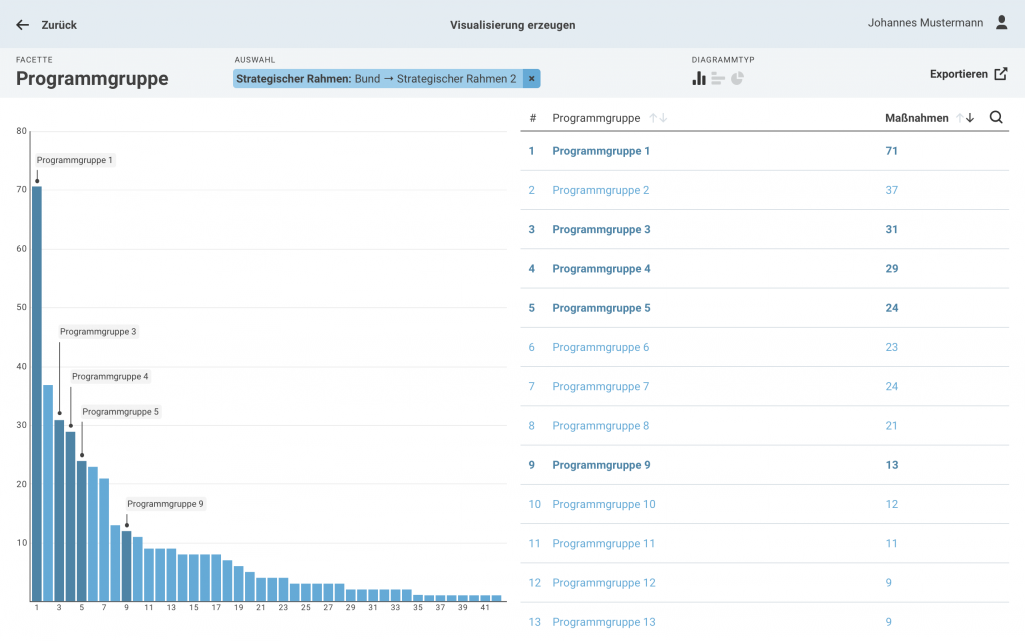
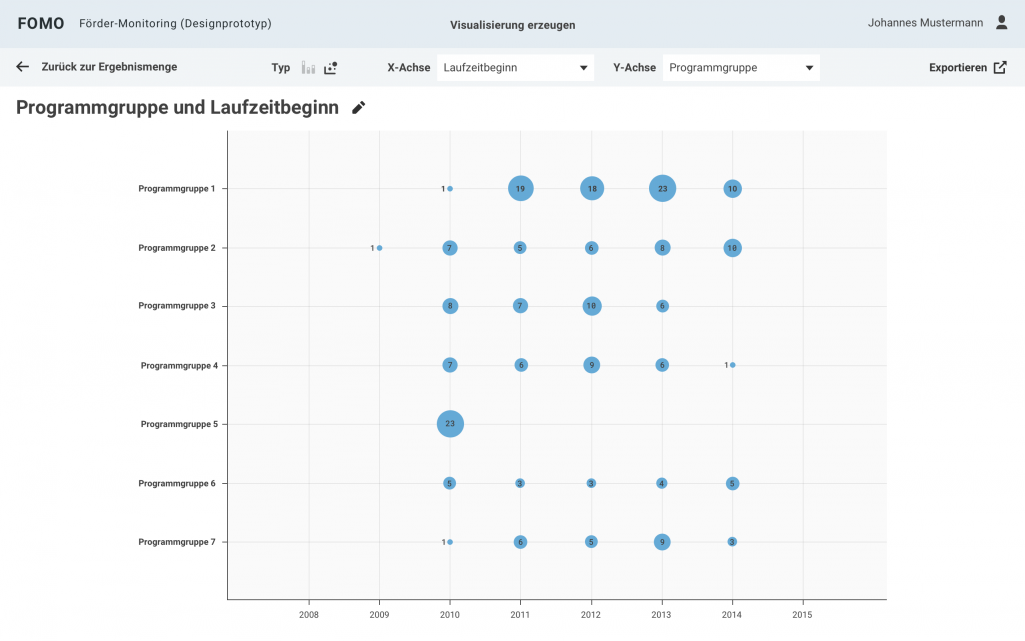
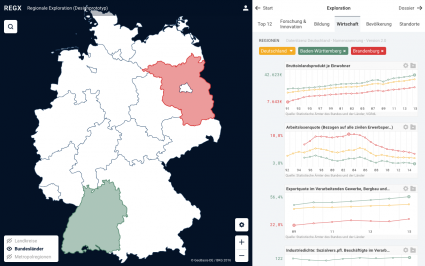
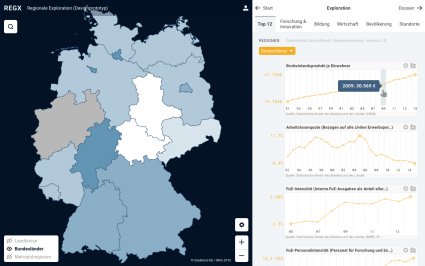
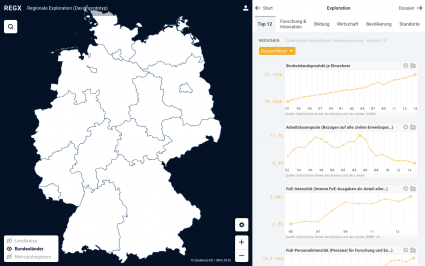
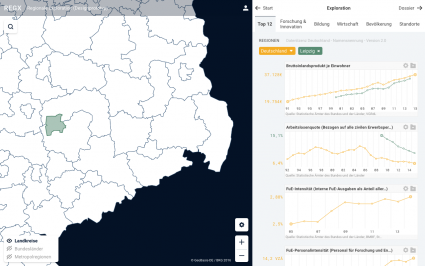
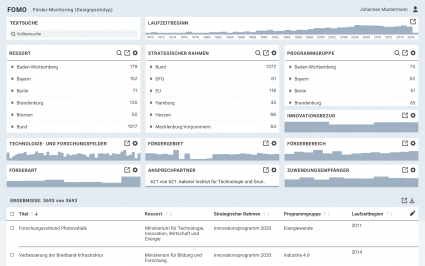
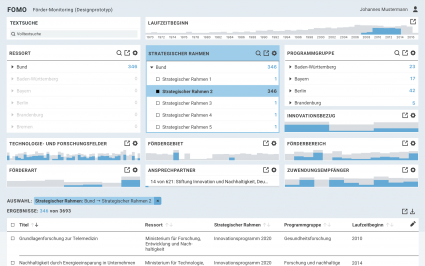
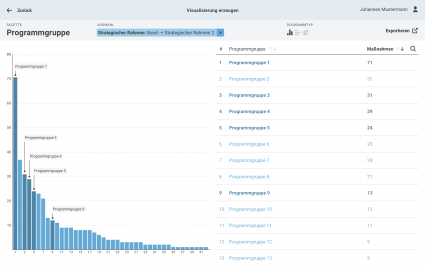
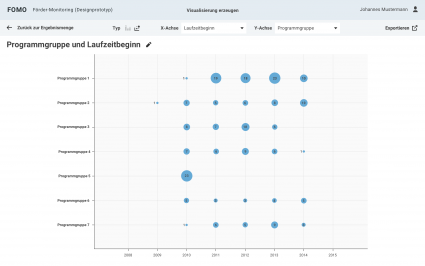
This iterative approach enabled us to design, develop and evaluate high-level prototypes for the knowledge management system used by the higher governmental department. The prototypes were fundamentally based on the insights gained in the co-creation process. The depicted screens above show a snapshot of the interface. Due to the confidential nature of the data, the interactive prototypes cannot be made publically available.
The VIND project not only resulted in the design of useful, usable and insightful data visualization components, but also in an innovative approach to co-creating data visualizations.
Sponsoring Agency:
Bundesministerium für Bildung und Forschung (BMBF)
53170 Bonn
Support Code (FKZ): 01HI16003P


