Jan-Erik Stange Interface Design & Textual Visualization
Jan-Erik Stange was a research associate and lecturer at the Urban Complexity Lab at FH Potsdam. His interest lies in textual data visualization, user interface design and storytelling.

Projects Contributions
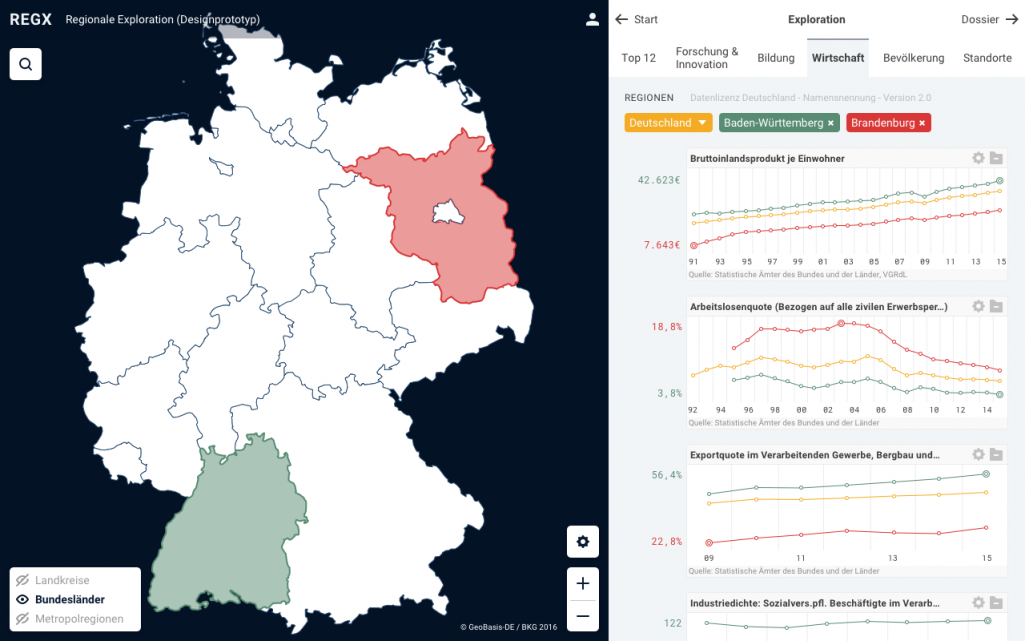
VIND
Visualization interfaces and user centered design for complex databases
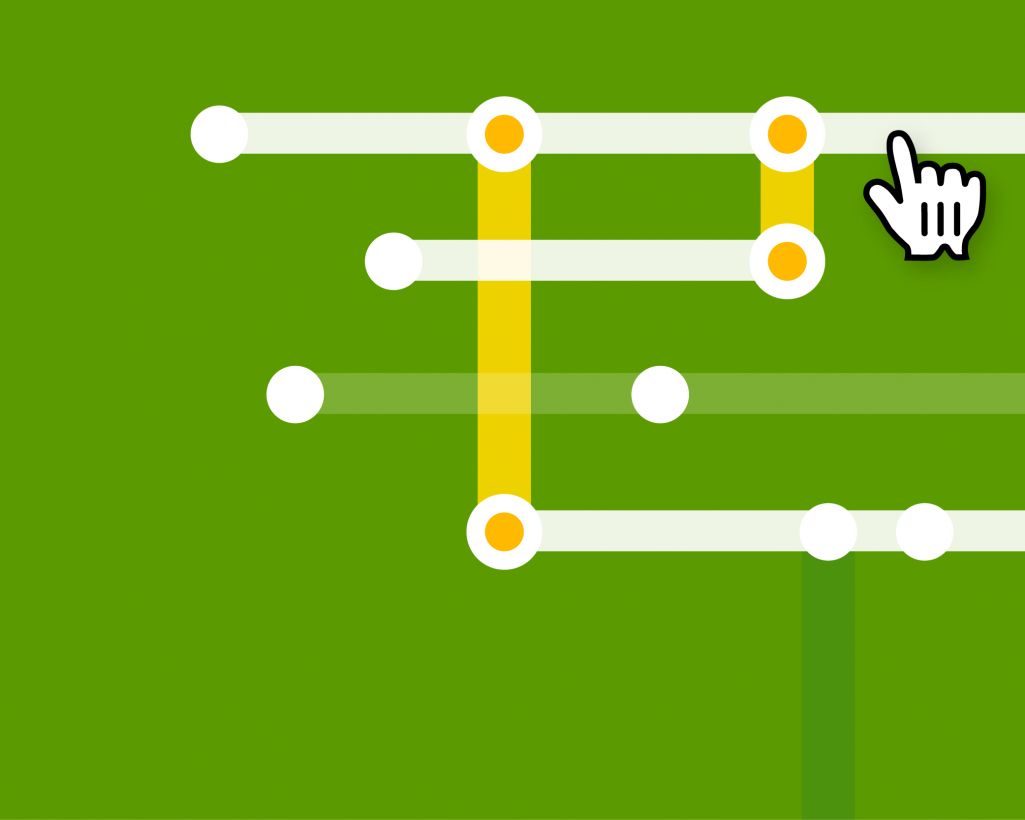
Novel City Maps
A poetic view on the city
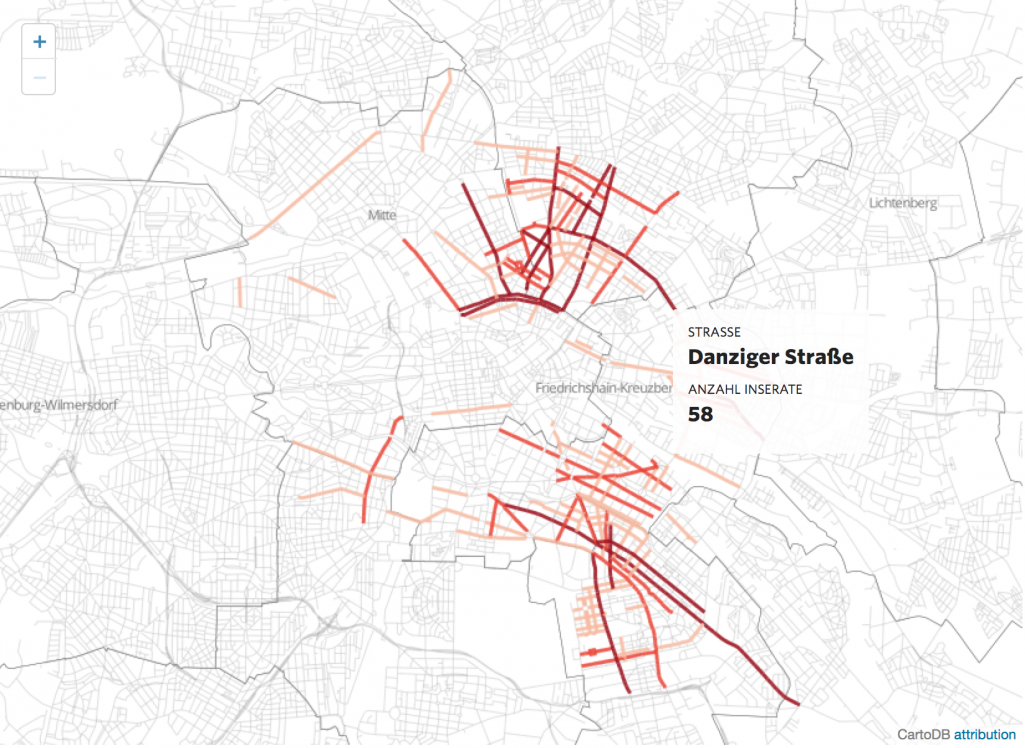
Airbnb vs. Berlin
Visualising the rise of the sharing economy
Publications Published Works
Co-Designing Visualizations for Information Seeking and Knowledge Management
Narrelations — Visualizing Narrative Levels and their Correlations with Temporal Phenomena
We present findings from interdisciplinary research at the intersection between literary studies, information visualization, and interface design. Despite a growing interest in text visualization among literary scholars, so far, narrative visualizations are not designed to support the particular tasks involved in narratological analysis and often fail to reveal nuanced narratological features. One major outcome of our iterative research and design process is Narrelations, a novel visualization technique specifically suited for analyzing and interpreting narrative levels of a story and temporal aspects of its narrative representation. The visualization provides an overview of the nesting and distribution of narrative levels, integrates the representation of temporal phenomena, and facilitates the examination of correlations between these aspects. With this research we explore how collaboratively designed visual encodings and interaction techniques may allow for an insightful analysis at a high level coupled with a close inspection of text passages. We discuss prior work relevant to our research objectives and explain the specific characteristics of narrative levels and temporal aspects of narrative representation. After describing the research process and design principles, we apply the visualization on a test corpus of eight annotated German short stories and demonstrate its heuristic value for literary analyses and interpretations. In particular, we explore the intricate connections between the literary content of the novellas and their narrative form.
Visualizing the spatiality in fictional narratives
This work is part of ongoing research on the visualization of spatial relationships in fictional works. Our aim is to arrive at aesthetic representations of fictional narratives set in actual places such as cities. Novel City Maps offers two map views, one inspired by transit maps and the other by conventional street maps. The former uses the aesthetic of abstract transit maps to reveal the co-occurrence structures between important places in a story. The street map view is designed as a spatial fingerprint of a novel by highlighting the places occurring often in the story.
Visual Filter: Graphical Exploration of Network Security Log Files
Network log files often need to be investigated manually for suspicious activity. The huge amount of log lines complicates maintaining an overview, navigation and quick pattern identification. We propose a system that uses an interactive visualization, a visual filter, representing the whole log in an overview, allowing to navigate and make context-preserving subselections with the visualization and in this way reducing the time and effort for security experts needed to identify patterns in the log file. This explorative interactive visualization is combined with focused querying to search for known suspicious terms that are then highlighted in the visualization and the log file itself.
Weaving a Carpet from Log Entries: a Network Security Visualization Built with Co-Creation
We created a pixel map for multi-variate data based on an analysis of the needs of network security engineers. Parameters of a log record are shown as pixels and these pixels get stacked to represent a record. This allows a broad view of a data set on one screen while staying very close to the raw data and to expose common and rare patterns of user behavior through the visualization itself (the “Carpet”). Visualizations that immediately point to areas of suspicious activity without requiring extensive fltering, help network engineers investigating unknown computer security incidents. Most of them, however, have limited knowledge of advanced visualization techniques, while many designers and data scientists are unfamiliar with computer security topics. To bridge this gap, we developed visualizations together with engineers, following a co-creative process. We will show how we explored the scope of the engineers’ tasks and how we jointly developed ideas and designs. Our expert evaluation indicates that this visualization helps to scan large parts of log fles quickly and to defne areas of interest for closer inspection.


