Fidel Thomet Interaction Design & Urban Futures
Fidel is a research associate at the ᴜᴄʟᴀʙ. His focus lies on data visualization, web engineering, and speculative futures.

He holds an MA in Urban Futures from the University of Applied Sciences Potsdam and a BA in Interaction Design from Zurich University of the Arts.
Before joining the ᴜᴄʟᴀʙ, Fidel worked for the City of Zurich’s statistical office, Aargauer Kunsthaus, Frankfurter Allgemeine Zeitung and as a freelance interaction designer.
Projects Contributions
 Project
Amazonia Future Lab
Connect – Comprehend – Communicate
 Project
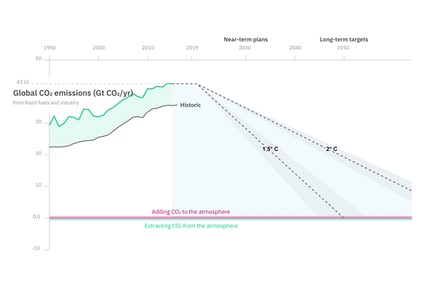
SENSES
Visualization and Communication of Climate Change Scenarios
 Project
INFORMATION+ 2018
International conference on information design & visualization in Potsdam
 Project
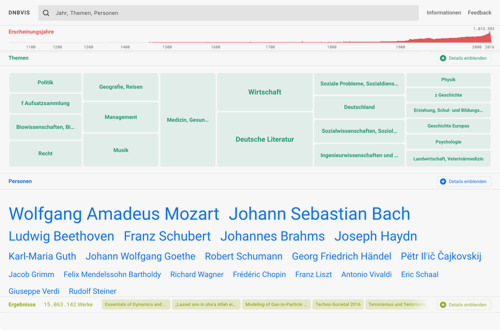
DNBVIS
Visualization of bibliographic data and content
Publications Published Works
Die bibliografischen Daten der Deutschen Nationalbibliothek entfalten
Wie sieht die Zukunft der Recherche in digitalen Bibliothekskatalogen aus? Wie können umfangreiche und heterogene Sammlungsbestände mit Hilfe von Datenvisualisierungen besser zugänglich gemacht werden? Kann man durch eine digitale Bibliothek flanieren und dabei den Bestand auf ganz neue Art entdecken? Diese Fragen standen im Zentrum eines Forschungsprojekts, das ein interdisziplinäres Team von Forscherinnen und Forschern des Urban Complexity Lab der FHP im vergangenen Jahr in Kooperation mit der DNB durchgeführt hat. Dieser Artikel stellt das Hauptergebnis des Projekts vor: DNBVIS, der Prototyp eines experimentellen Kataloginterfaces. Anschließend werden die Vorgehensweise und wichtigsten Erkenntnisse des Projekts zusammengefasst.