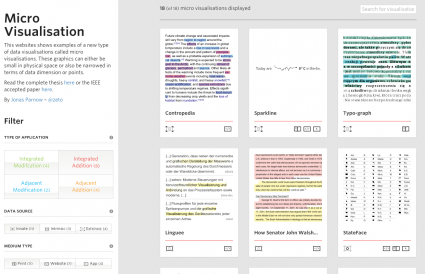
Micro Visualisations How can visualisations enhance typography?
Based on the disciplines of data visualisation and typography, this thesis discusses visualisations as a means to enrich text to improve text text comprehension and memorability. A taxonomy is proposed that differentiates specific types of application visualisations may have in this context.
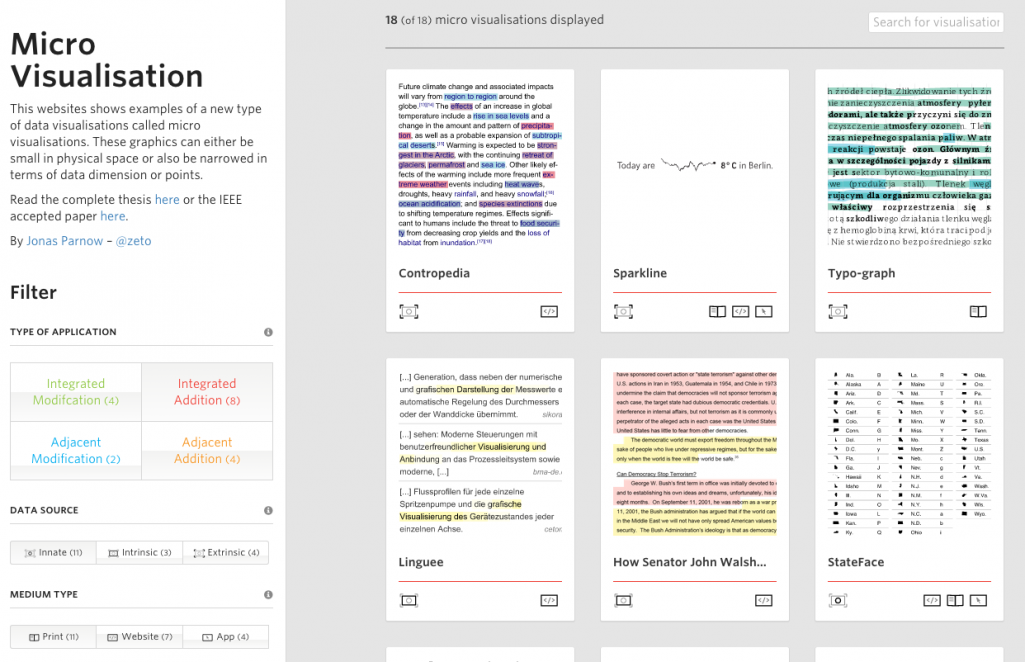
Drawing upon the taxonomy, the thesis elaborates two approaches to aligning a text’s visual appearance and its content. The first explores the addition of graphical elements right within or adjacent to a text while the other approach explores the optical modification of a text by means of visualisation. For this I evaluate how typographic techniques can be used as visual variables. Along with the proposed systematic I introduce the term »Micro Visualisation« describing the non-complex enhancements made to the »amorphous« text. In this work I summarize the historical derivation of text and images from a media-theoretical perspective, discuss my approach in regard to the current state of the two disciplines of visualisation and typography, introduce a taxonomy in order to categorize existing work and conclude with an analysis of opportunities and challenges for future work.