GraDiM
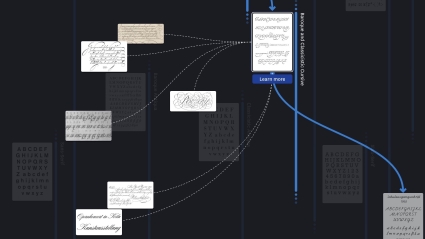
Granularities of Dispersion and Materiality: Visualizing a Photo Archive About Diaspora
DH
We are in Lisbon for DH2025 with several contributions: Viktoria Brüggemann and Mark-Jan Bludau talk about collage as co-creative design method. Silvia Casavola presents her MA project Stereoscopic Journals, which she carried out in GraDiM. And Kirill Mitsurov, presents a poster on 3D Stories.
Inflecting Data Visualizations for Web-based Scrollytelling
We propose the idea of inflections as a method for capturing and conveying interpretative interactions with data visualizations. Aiming to narrow the gap between data analysis and story authoring, inflections are subtle modulations of a …
Information is Beautiful Award
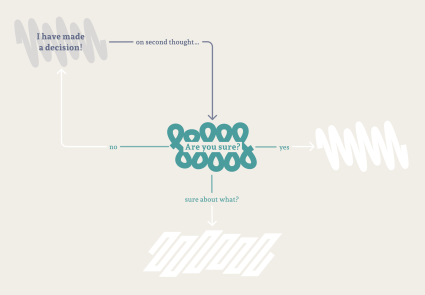
»I Want a Better Catastrophe: A Flowchart for Navigating our Climate Predicament« wins Gold at the Information is Beautiful Awards, which are organized by the Data Visualization Society.
Fluidly Revealing Information: A Survey of Un/foldable Data Visualizations
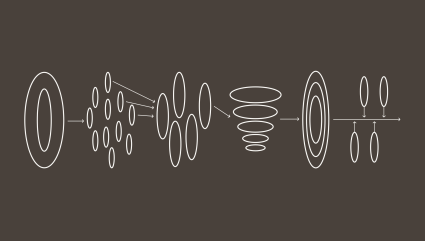
Revealing relevant information on demand is an essential requirement for visual data exploration. In this state-of-the-art report, we review and classify techniques that are inspired by the physical metaphor of un/folding to reveal relevant …
IPPSO
Exploring the Future of Phygital Public Spaces
Visualizing Cultural Collections
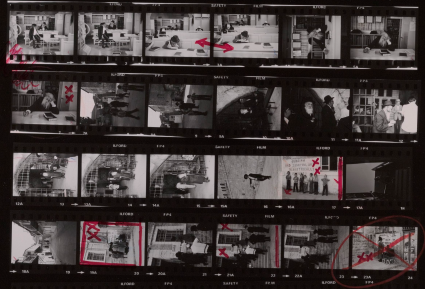
Project course on visualizing a Jewish diaspora photo archive with Frédéric Brenner & GraDiM. Teams design novel visual overviews and data stories, linking semantics, relations, and visuals. The course work spans data analysis to prototypes, yielding a research paper and web prototype.
View more ↗︎
Critical Interactivity: Exploration and Narration in Data Visualization
We propose critical interactivity as a concept to study and design the dynamic and transitory aspects of data visualizations. Theoretically, interactivity is often described as the means to support analytical tasks, while in practice, it encompasses …
EuroVis
We are at EuroVis 2025 in Luxembourg. Mark-Jan Bludau presents a state of the art report on un/foldable data visualizations and Theresa Eingartner gives a talk on inflections of data visualizations.
Interactive Information
This course embraces the web as a versatile and expressive medium for creating information-rich and dynamic interfaces. From buttons and boxes to events and animation, students will learn the basic building blocks for prototyping interactive web pages for diverse audiences and platforms.
Towards Collective Storytelling: Investigating Audience Annotations in Data Visualizations
This work investigates personal perspectives in visualization annotations as devices for collective data-driven storytelling. Inspired by existing efforts in critical cartography, we show how people share personal memories in a visualization of …
3D Stories
Telling Stories about Historical Dress
V³
Mark-Jan Bludau participates in the 2025 Workshop on Visualization, Visual Analytics, and Visual Computing (V3) in Neustrelitz, Germany.
Complexity as Design Material
Complexity is often seen as a inherent negative in information design, with the job of the designer being to reduce or eliminate complexity, and with principles like Tufte’s “data-ink ratio” or “chartjunk” to operationalize minimalism and simplicity …
Loops
Markus Kreutzer gives a talk about the linguistic preconfiguration of computational narration at Loops, a public event series of New Practice in cooperation with the Berlin University Alliance.
Interactive Flowchart
Navigating and Narrating Complexity Through Exploration and Storytelling
Institute of Design Research
Boris Müller gives a talk at the Institute of Design Research in Bern. The title of the talk is »Daten → Design → Visualisierung«. He will present and discuss design research activities and strategies from the UCLAB.