Visualization as a tool for analysis, exploration and communication has become a key tool in the task of unravelling the complex fabrics that form our cities. The Visualizing Cities competition launched in the summer of 2016 asked for innovative visualizations that could help us make sense of our transforming cities. The call attracted over 100 visualization projects from around the world on a wide range of issues. All entries are available on an open platform at cityvis.io.
Understanding our cities is a more complex task than ever before. From the expanding physical structures that form our cities, to the growing number of human beings filling those structures with life and meaning, to the almost invisible layer of digital technologies and data streams increasingly connecting all those elements. Many of the processes steering our cities today are not visible to the human eye. How can we make these underlying currents visible and understandable? In the lead-up to Habitat III, the UN summit on urbanization, the Visualizing Cities competition solicited the latest and best projects aiming to answer this question.
The complexity of the processes at work calls for methods and tools to improve understanding of the urban realm and underlying relationships and connections, for all stakeholders from urban planners, decision makers and companies to citizens. Visualization experts around the world are developing and refining new techniques to make these urban processes more transparent and understandable. So far many projects are hidden in academic publications or within university and company archives. The call tried to bring together cutting edge visualization projects from around the world, to strengthen the ties between the visualization community and the urban development stakeholders.
The competition has attracted some of the world’s leading data visualization talent. Submissions from researchers, journalists, students and designers captured major trends related to sustainable urban futures – migration, climate, transport, food and energy. Most submissions underline the creative, inventive, and engaged nature of an emerging community of city visualizers. Especially the five winning entries are taking on difficult social and ecological challenges facing cities around the world:
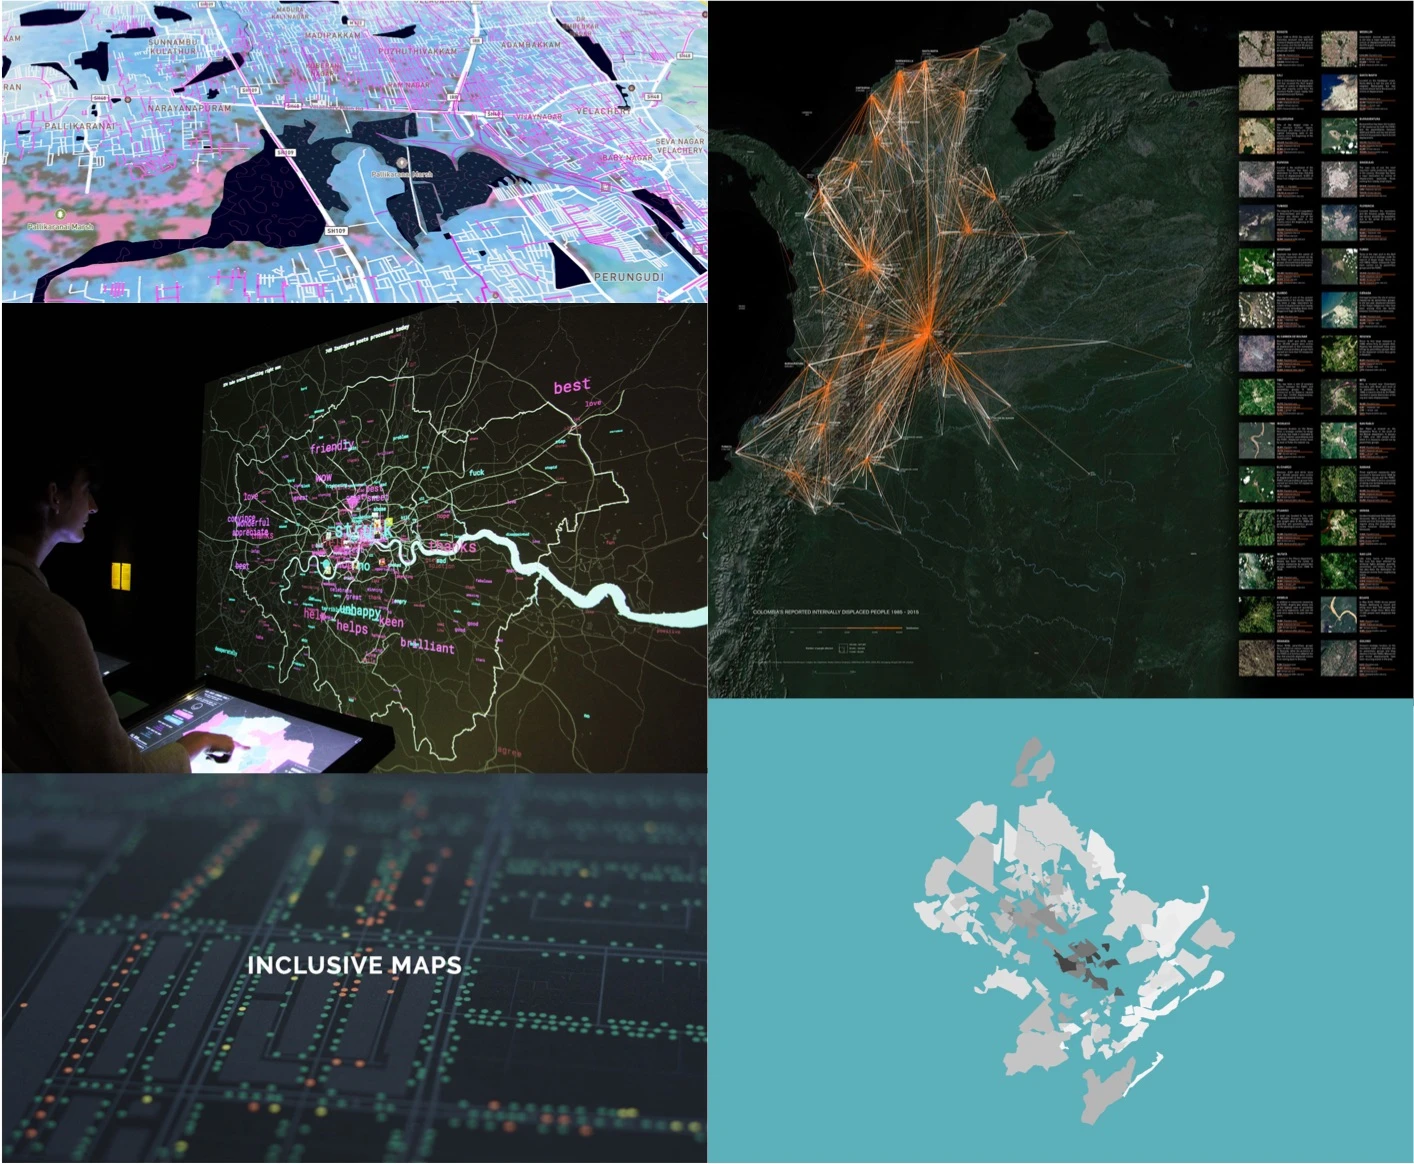
- Research: Conflict Urbanism: Colombia by Laura Kurgan, Juan Francisco Saldarriaga, Dare Brawley and Anjali Singhvi (Center for Spatial Research, Columbia University)
- Contract: London Data Streams by Jacopo Hirschstein & Amanda Taylor (Tekja Data Visualisation)
- Journalistic: Visualizing The Racial Divide by Jim Vallandingham (Bocoup)
- Civic: Chennai Flood Map by Arun Ganesh, Sajjad Anwar, Sanjay Bhangar, Prasanna Loganathar, Aruna Sankaranarayanan (OpenStreetMap India / Mapbox)
- Student: Inclusive Maps by Lio Benz, Sylvia Kautz and Sebastian Rauer (Students of Interface Design at University of Applied Sciences Potsdam)
An international reviewing committee of 40 experts from science, design and urban studies has rated the entries according to four main criteria: relevance, innovation, applicability, and accessibility. The winners were announced during Habitat III and the top 50 projects were on display at the Habitat X Change space in Quito. All entries to the open call are now available on cityvis.io, an open platform for visual urban knowledge production. The plan is to continually expand the platform as a living resource for the growing community of city visualizers.
This project was a collaboration with the International Council for Science and Future Earth.