VisTent Visualizing urban data using top-projected city models
The VisTent is an experiment in city visualization that brings together the physical character of city models and the dynamic quality of data visualizations. The long-term aim of this project is to enable lay audiences to carry out analyses and explorations of urban data.
Cities, companies, and civic groups are increasingly using data and visualizations to engage in a dialogue about urban issues. While digital visualizations are more and more used for this purpose, the physical city model has a long tradition in urban planning, in particular due to its accessible and comprehensible properties. Natural landmarks such as rivers and parks feature prominently in these models and help the viewer to orient oneself in often complex grids of streets and intersections.
The basic idea behind this project is to explore the potential of a hybrid visualization system that combines physical city models with digital representations urban data. The general aim is to devise a system that is usable by varied audiences and reusable in diverse situations.
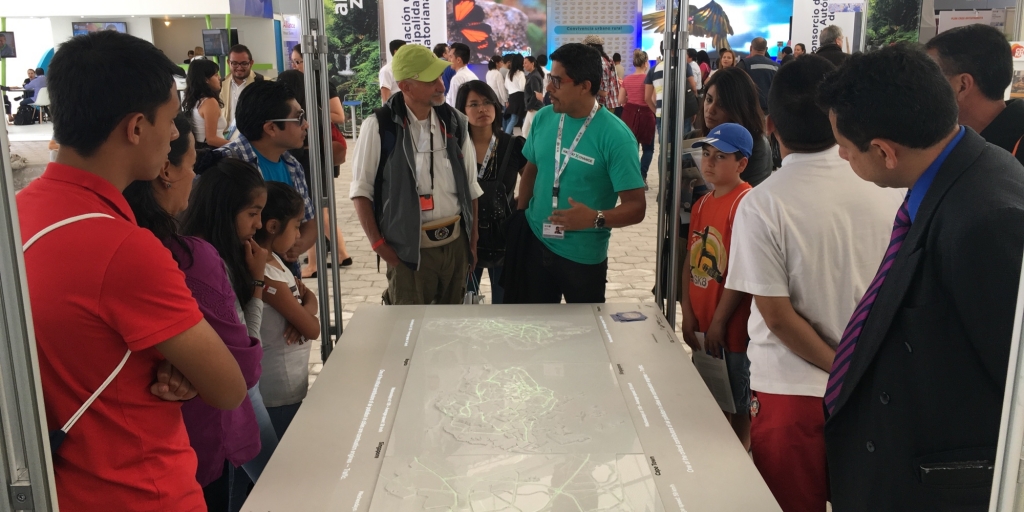
A first prototype of the VisTent was developed for Habitat X Change at the UN conference Habitat III, which took place in Quito, Ecuador in October 2016. The setup consisted mainly of three city models on a table, over which a portable structure held a projector and mirror directing the light onto the models.
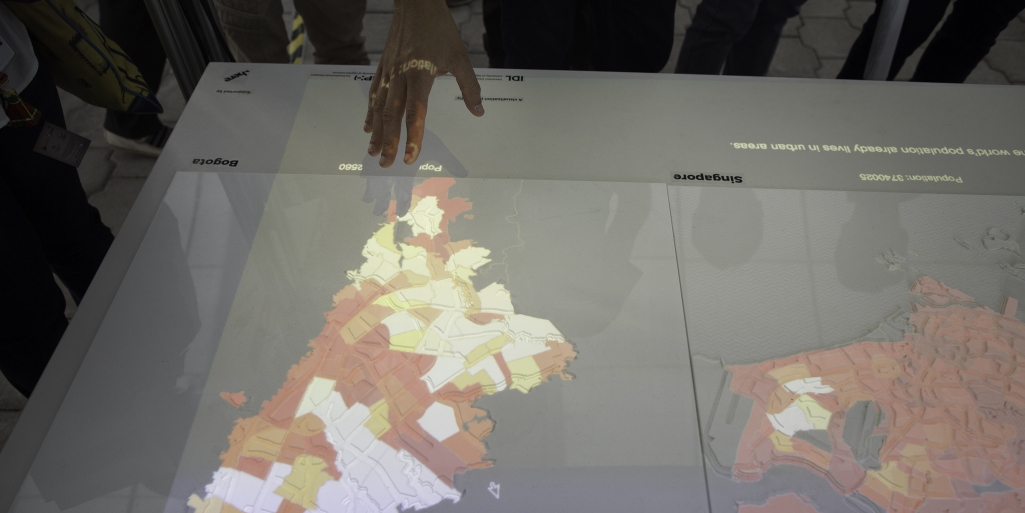
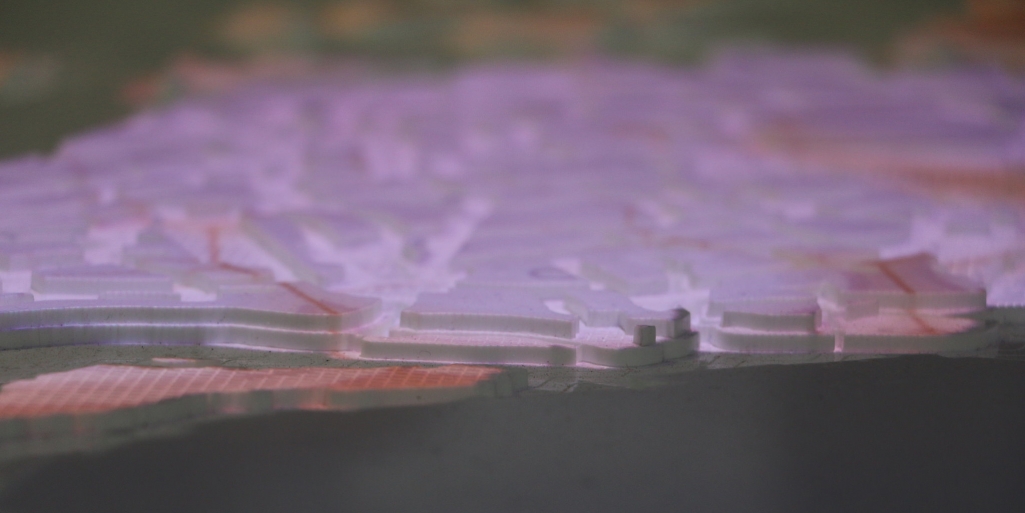
The physical city models of Bogotá, Cape Town and Singapore feature three heights to differentiate between three broad area types: water (sea, rivers, lakes), land (e.g. streets and parks), and built-up areas (mostly buildings). The models consist of acrylic plastic sheets cut using a laser-cutter and glued together to represent the different area types as different levels. In addition, textures were added to the second level to distinguish between green areas and asphalt. A uniform scale was chosen for the three cities to allow for reliable spatial comparisons.
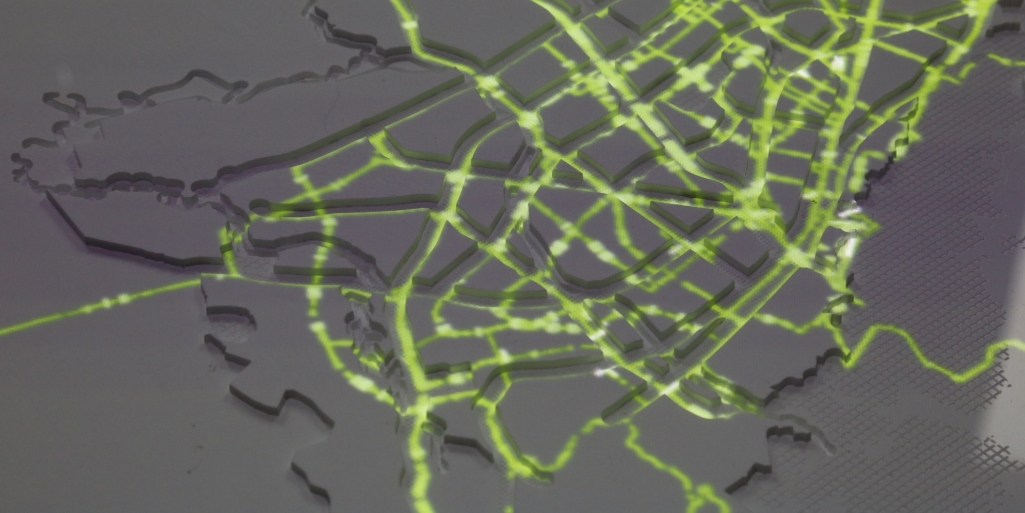
The projected visualizations were designed to show basic information about the three cities: historical growth, population density, distribution of libraries, car traffic throughout the week, and rapid transit networks. Most of the information was sourced from open-data portals.
The VisTent served as a conversation starter at Habitat X Change engaging researchers, policymakers, and citizens in exchanges about the role of data in city planning and sustainable urban transformation. The next steps are to explore other cities and urban dimensions and to investigate the potential for interactivity.
This project was inspired and supported by HERE.
Photos by Johannes Mengel, Edu Léon and Stephanie Neumann.