Is the bus late? Or did I miss it? A visual analysis of public transport real-time data
Punctuality is one of the features most demanded by public transport customers. However, the reasons for irregularity in schedules are diverse and often counterintuitive. The project in collaboration with Tagesspiegel Berlin pursued both a classic and a data journalist approach to find reasons for punctuality problems regarding the Berlin public transport authority, BVG.
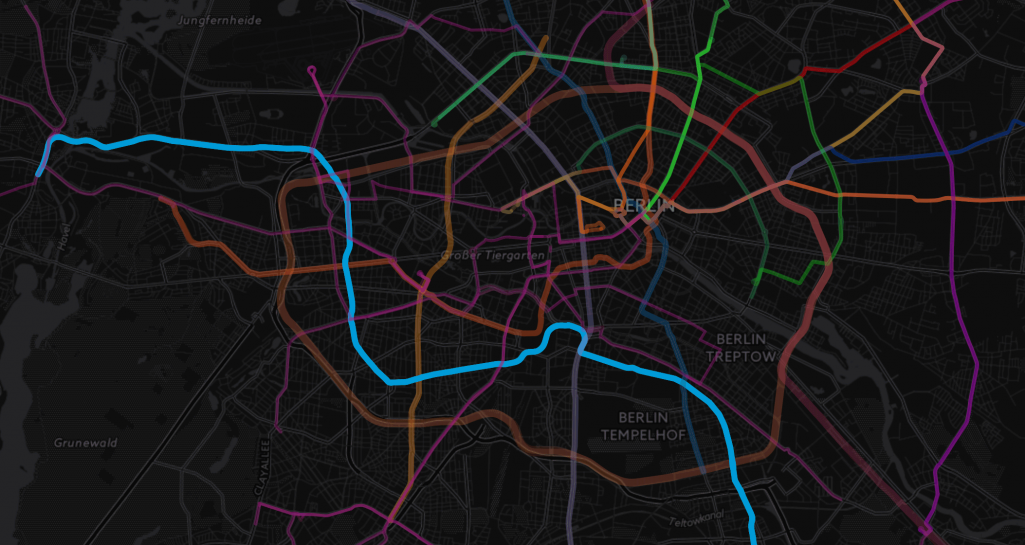


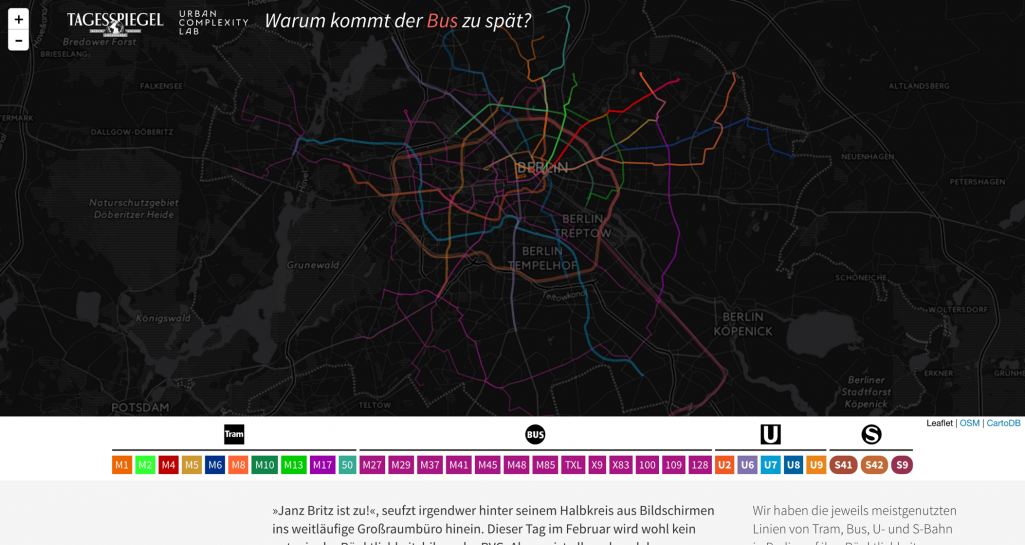
The data visualisation approach draws upon a data set six weeks worth of station-based, minute-by-minute realtime departure data for 31 of the most frequented bus, tram, metro, and urban train lines.
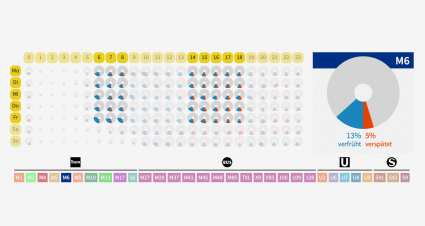
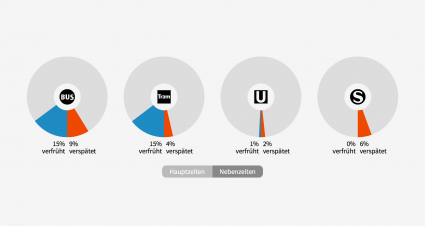
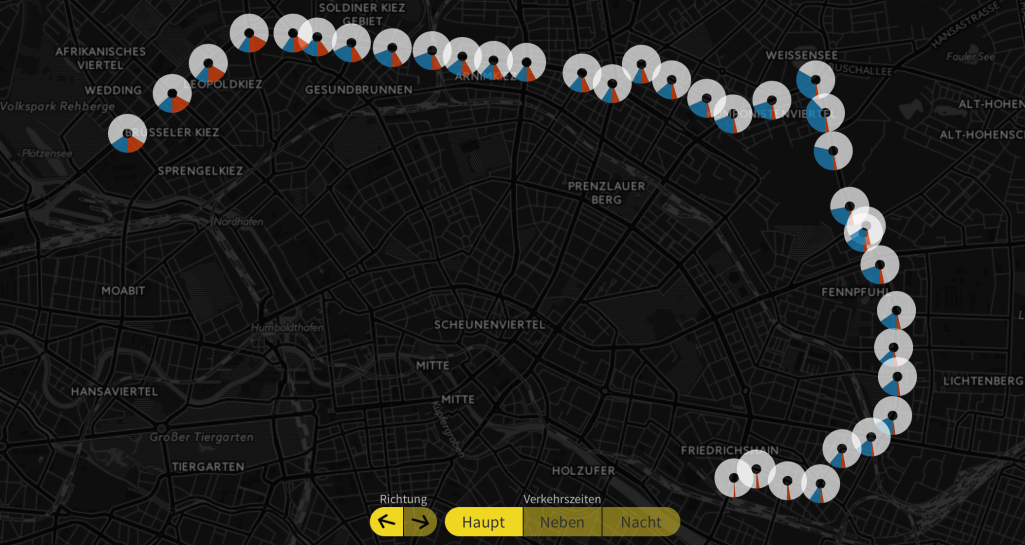
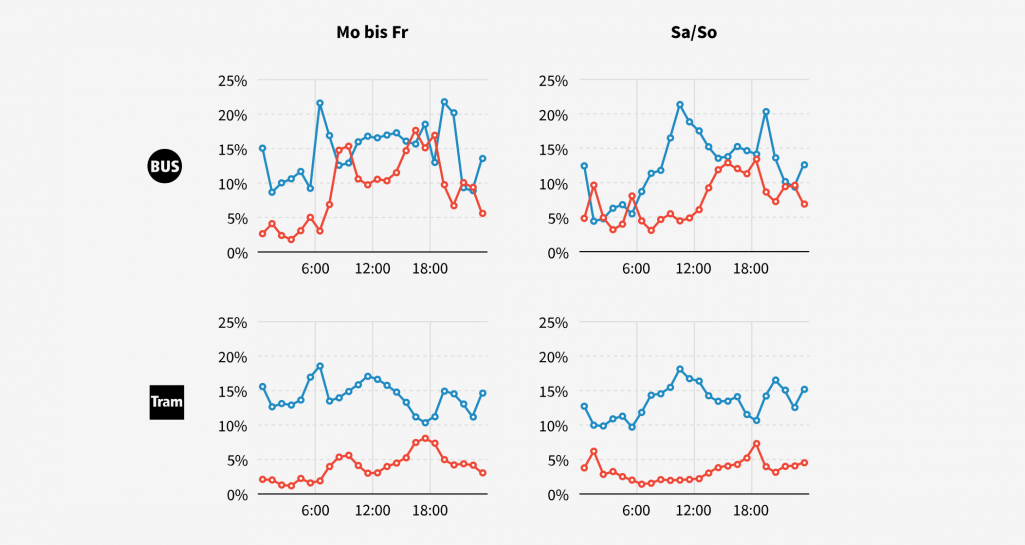
A key feature of the project is the distinction of on-time, late, and early departures, the latter being identified as the more underestimated problem.
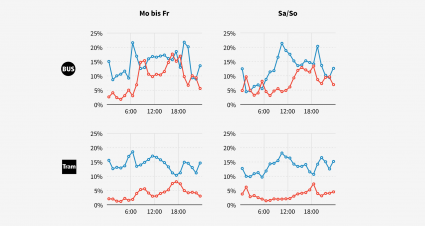
The project comprises several mostly interactive visualisation approaches: a station-based per-line map visualisation, a high-resolution hours-by-weekdays matrix for each line, and comprehensive statistical visualisations to distinguish time- and mode-specific behaviour.
The textual part gives interesting insights in the measures of quality assurance taken by the authorities. It explains the reasons for some of the most urgent punctuality issues, some of which are supported by the data, e.g. higher punctuality issues in transport modes that have to share their paths with individual road traffic. However, not all findings from the data were explained by the experts, e.g. the high early departure rates and early-late departure ratios found in some tram lines.