GEI-Digital Visualized Visualizing a digital library of historical textbooks
This data dossier provides multi-faceted perspectives on GEI-Digital, a digital library of historical schoolbooks from Germany. The visualizations represent data patterns in the collection along various collection facets such as publisher, place, subject, school type, and grade.

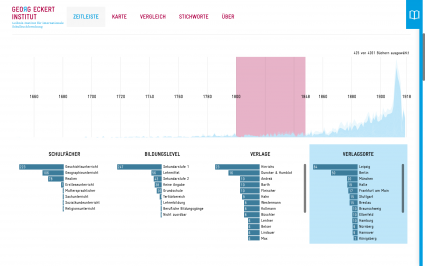
The Georg Eckert Institute for International Textbook Research (GEI) is carrying out a comprehensive effort on digitizing historical textbooks from Germany for a variety of school subjects. As the set of digitized items in GEI-Digital grows, pressing questions are, what does the collection contain and how is it distributed along time, place, subject, and other facets? In this project, we collaborated with historians and data scientists of GEI to conceive a range of novel perspectives on this rich information space. The result is a single-page website featuring four interlinked visualizations: timeline, map, comparison, and tags.
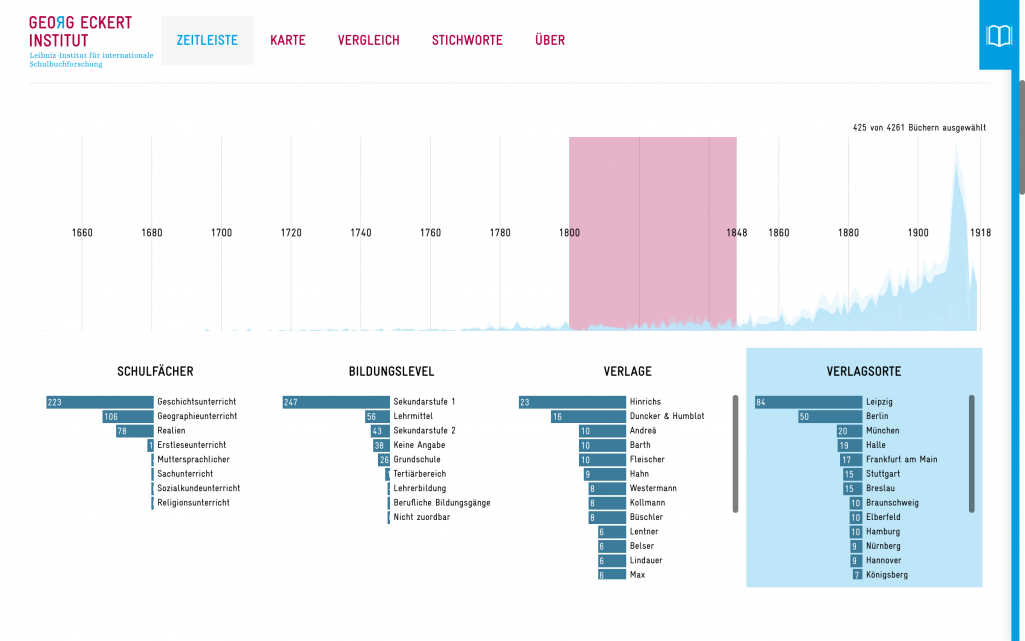
The timeline represents the temporal distribution of school books in conjunction with the facets school subject, education level, publisher. and publishing place. When a facet is selected its top values are distinguished in the timeline. Temporal selections made in the timeline carry over to the three other visualizations. The timeline turns into a small widget located on the top of the screen that remains available for temporal adjustments to filter the subsequent views.
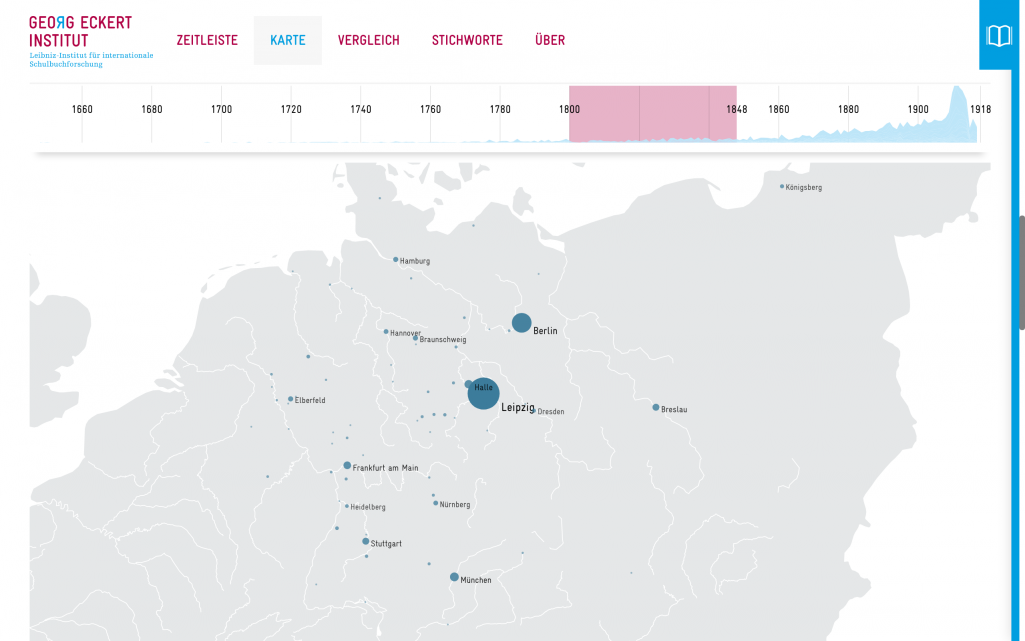
The map visualization offers a simple overview of the spatial distribution of the textbooks according to the places of publication. We refrained from including national borders considering their historical volatility. Instead the combination of rivers, coastal lines along the North Sea and Baltic sea and the circles representing cities should provide sufficient spatial orientation. Selecting a city reveals the books associated with this publishing place in the book drawer on the right side.
In the comparison view the facets can be visualized in a tabular arrangement that is intended to support comparative analysis. For example, it is possible to examine the distribution places along school subjects.
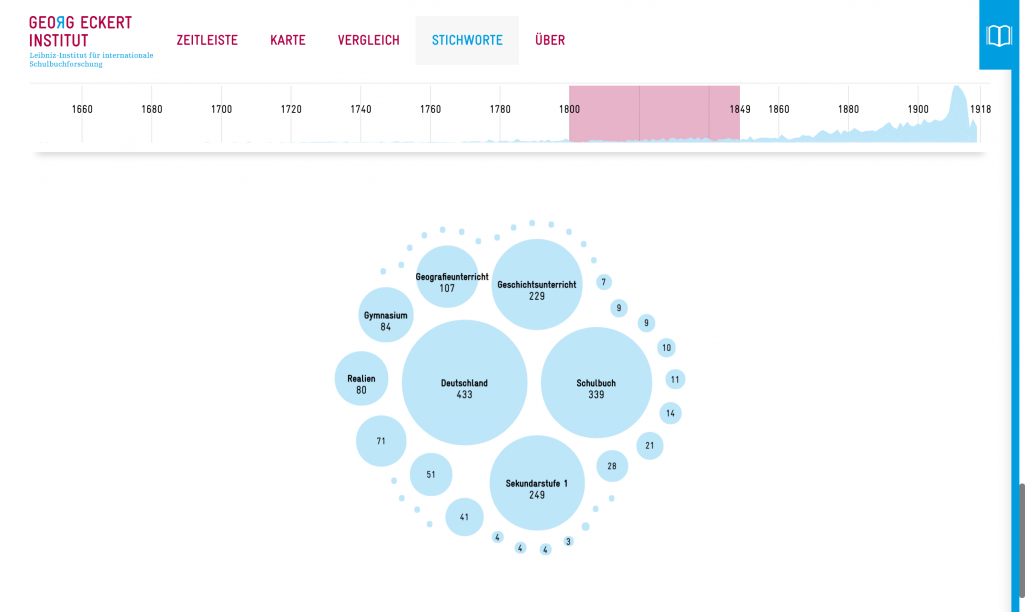
A tag view is the last visualization representing the top keywords as circles of varying sizes and how they are associated across the collection. By interacting with the visualization it is possible to explore the co-occurrences among a variety keywords.
This project is a collaboration with the Georg Eckert Institute for International Textbook Research.