Francesca Morini Information Visualization & Data Journalism
Francesca Morini is a research associate at the UCLAB and a PhD student in Media and Communication Studies at the School of Culture and Education at Södertörn University in Sweden

She recently achieved a MA in Communication Design at the Politecnico di Milano, with a focus on interface design and data visualization. She holds a bachelor degree in Communication Science at the Università degli Studi di Modena e Reggio Emilia, where she gained theoretical expertise in semiotics and visual communication techniques. In her master thesis she explored how temporal patterns in urban environments can be contextualized and made visible through subjective and critical data gathering. She is currently pursuing a PhD at the School of Culture and Education at Södertörn University in Sweden. Her research interests lie at exploring the intersection of information visualization and data journalism. Francesca’s pronouns are she/her.
Projects Contributions
 Project
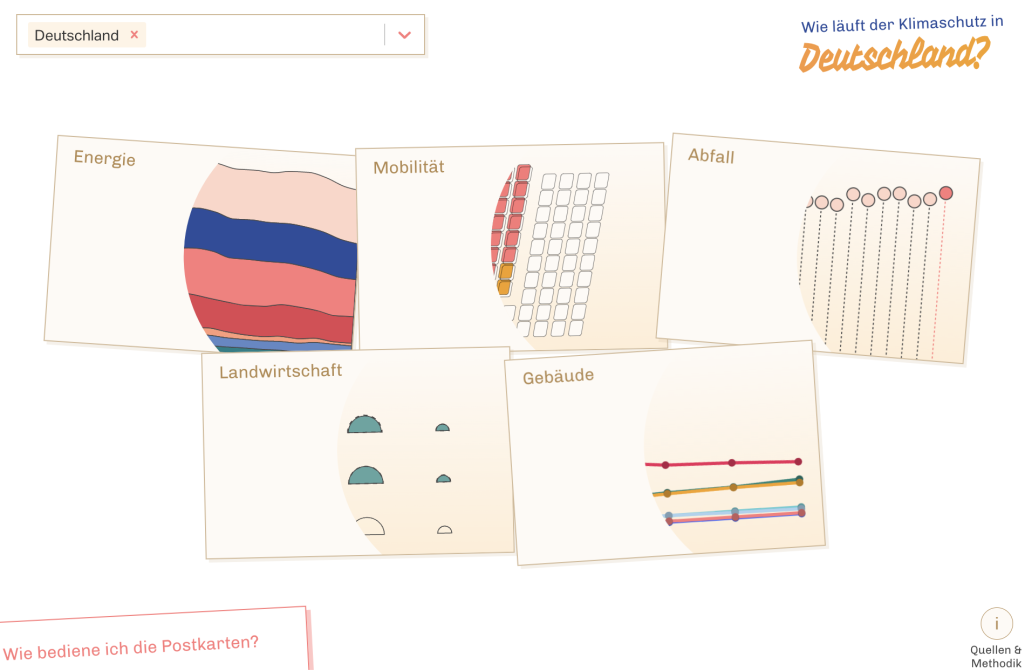
Klimakarten
From shock to shift
 Project
SENSES
Visualization and Communication of Climate Change Scenarios
 Project
VIDAN
Visual and dynamic arrangements of narratives
Publications Published Works
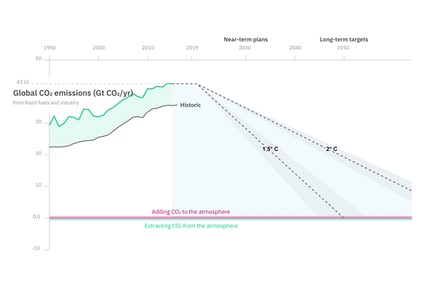
From shock to shift: Data visualization for constructive climate journalism
We present a multi-dimensional, multi-level, and multi-channel approach to data visualization for the purpose of constructive climate journalism. Data visualization has assumed a central role in environmental journalism and is often used in data stories to convey the dramatic consequences of climate change and other ecological crises. However, the emphasis on the catastrophic impacts of climate change tends to induce feelings of fear, anxiety, and apathy in readers. Climate mitigation, adaptation, and protection—all highly urgent in the face of the climate crisis—are at risk of being overlooked. These topics are more difficult to communicate as they are hard to convey on varying levels of locality, involve multiple interconnected sectors, and need to be mediated across various channels from the printed newspaper to social media platforms. So far, there has been little research on data visualization to enhance affective engagement with data about climate protection as part of solution-oriented reporting of climate change. With this research we characterize the unique challenges of constructive climate journalism for data visualization and share findings from a research and design study in collaboration with a national newspaper in Germany. Using the affordances and aesthetics of travel postcards, we present Klimakarten, a data journalism project on the progress of climate protection at multiple spatial scales (from national to local), across five key sectors (agriculture, buildings, energy, mobility, and waste), and for print and online use. The findings from quantitative and qualitative analysis of reader feedback confirm our overall approach and suggest implications for future work.
Data Stories of Water: Studying the Communicative Role of Data Visualizations within Long-form Journalism
Data Journalism as “Terra Incognita”: Newcomers’ Tensions in Shifting Towards Data Journalism Epistemology
This article investigates data journalism epistemology through Michel Foucault’s definition of power. The growing demand for data-savvy reporters with computational skills has been proven to shift the newsrooms’ culture in media companies across the globe. Previous research has documented journalists’ shift towards a data-centred epistemology and the increasingly important role of computation and data-driven practices in newsrooms. By focusing on inexperienced journalists as they mobilise data journalism for the first time, this research openly discusses its epistemology as a form of Foucauldian power: which epistemological tensions – individual or structural – emerge among newcomers when reporting extensively with data? The article presents the case of a newly formed data journalism team at taz, a German cooperative media company. It is based on qualitative data collected through action research, namely six in-depth interviews, auto-ethnographic notes and self-reflective inquiries. Data are framed through Foucault’s concepts of power and will to truth. Results show the discord between data journalism epistemology and its practical implementation. Despite prioritising democratic access to data, technologies and non-hierarchical forms of cooperation, data journalism remains largely dependent on traditional methods and culture.
Attitudinal effects of data visualizations and illustrations in data stories
Journalism has become more data-driven and inherently visual in recent years. Photographs, illustrations, infographics, data visualizations, and general images help convey complex topics to a wide audience. The way that visual artifacts influence how readers form an opinion beyond the text is an important issue to research, but there are few works about this topic. In this context, we research the persuasive, emotional and memorable dimensions of data visualizations and illustrations in journalistic storytelling for long-form articles. We conducted a user study and compared the effects which data visualizations and illustrations have on changing attitude towards a presented topic. While visual representations are usually studied along one dimension, in this experimental study, we explore the effects on readers’ attitudes along three: persuasion, emotion, and information retention. By comparing different versions of the same article, we observe how attitudes differ based on the visual stimuli present, and how they are perceived when combined. Results indicate that the narrative using only data visualization elicits a stronger emotional impact than illustration-only visual support, as well as a significant change in the initial attitude about the topic. Our findings contribute to a growing body of literature on how visual artifacts may be used to inform and influence public opinion and debate. We present ideas for future work to generalize the results beyond the domain studied, the water crisis.
Sensing What’s New: Considering Ethics When Using Sensor Data in Journalistic Practices
As data are becoming increasingly central to journalistic practice, a number of technology-driven approaches are emerging among data journalists. This article focuses on sensor journalism, which brings new practical and ethical concerns to journalism. By interviewing and working with data journalists and journalism scholars, we analyze the new technological and ethical challenges that sensors bring to journalism. The results contribute to the knowledge on how data journalists implicitly embed ethical values into their everyday work. Furthermore, they suggest that general ethical values are revisited and extended by the influence of sensors.