Background
The visualizations are the result of an exploratory study aimed at generating innovative perspectives on the collection of the German Digital Library (Deutsche Digitale Bibliothek, DDB) and make them available as visual and interactive representations.
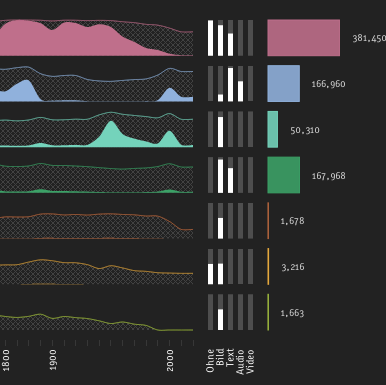
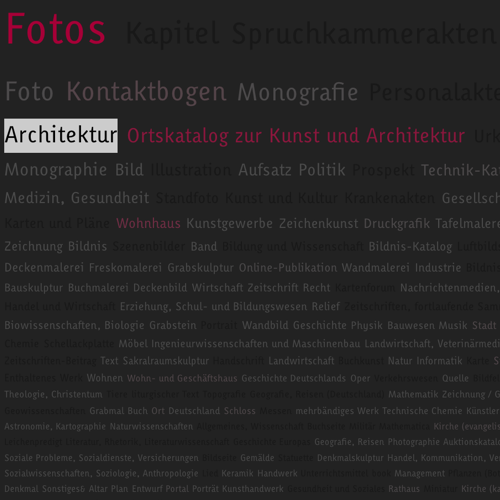
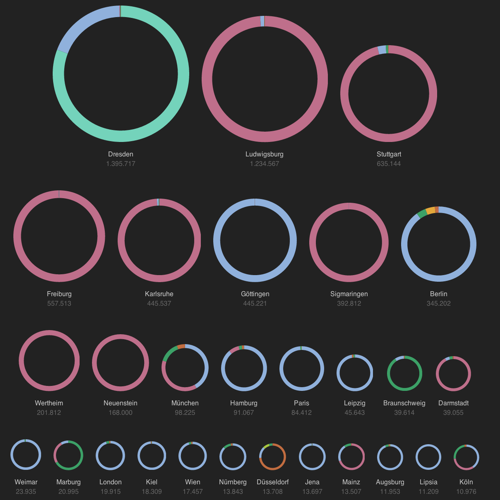
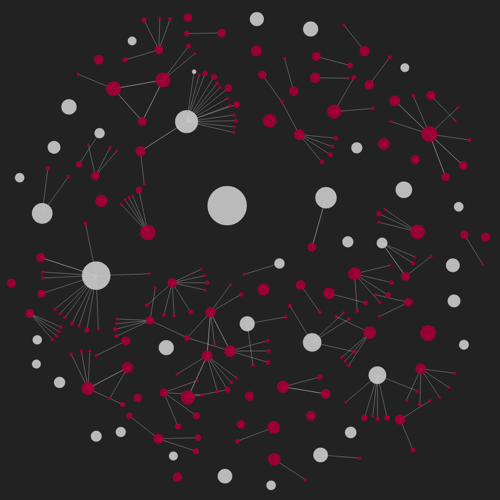
In contrast to existing search interfaces, which show only a few objects as part of result lists, the presented views should show the distribution of objects along time, place, topic, people, and other dimensions.
FAQ
How are the visualizations related with the metadata fiels of the DDB?
The visualizations are solely based on the facets (e.g., persons & organizations),
which the DDB exposes via the search interface or the API method indexing-profile.
Are the visualizations optimized for accessibility?
No, at the moment the pages and visualizations are unfortunately not yet optimized towards accessibility.
Why do the numbers of the objects sometimes do not match the numbers displayed on the DDB website?
The visualizations are based on a data snapshot from June 2014 and do not represent the current state of the DDB collection.
Which browser versions are supported?
The visualizations were developed towards the current versions of the four most used browsers (June 2014): Chrome 35, Safari 7, Firefox 30, Internet Explorer 11. The visualizations have not yet been optimized for mobile devices.
What is the design concept behind the visualizations?
Good question! We gave a presentation at Information+ 2016 about this project and wrote an article in the Information Design Journal (Preprint).